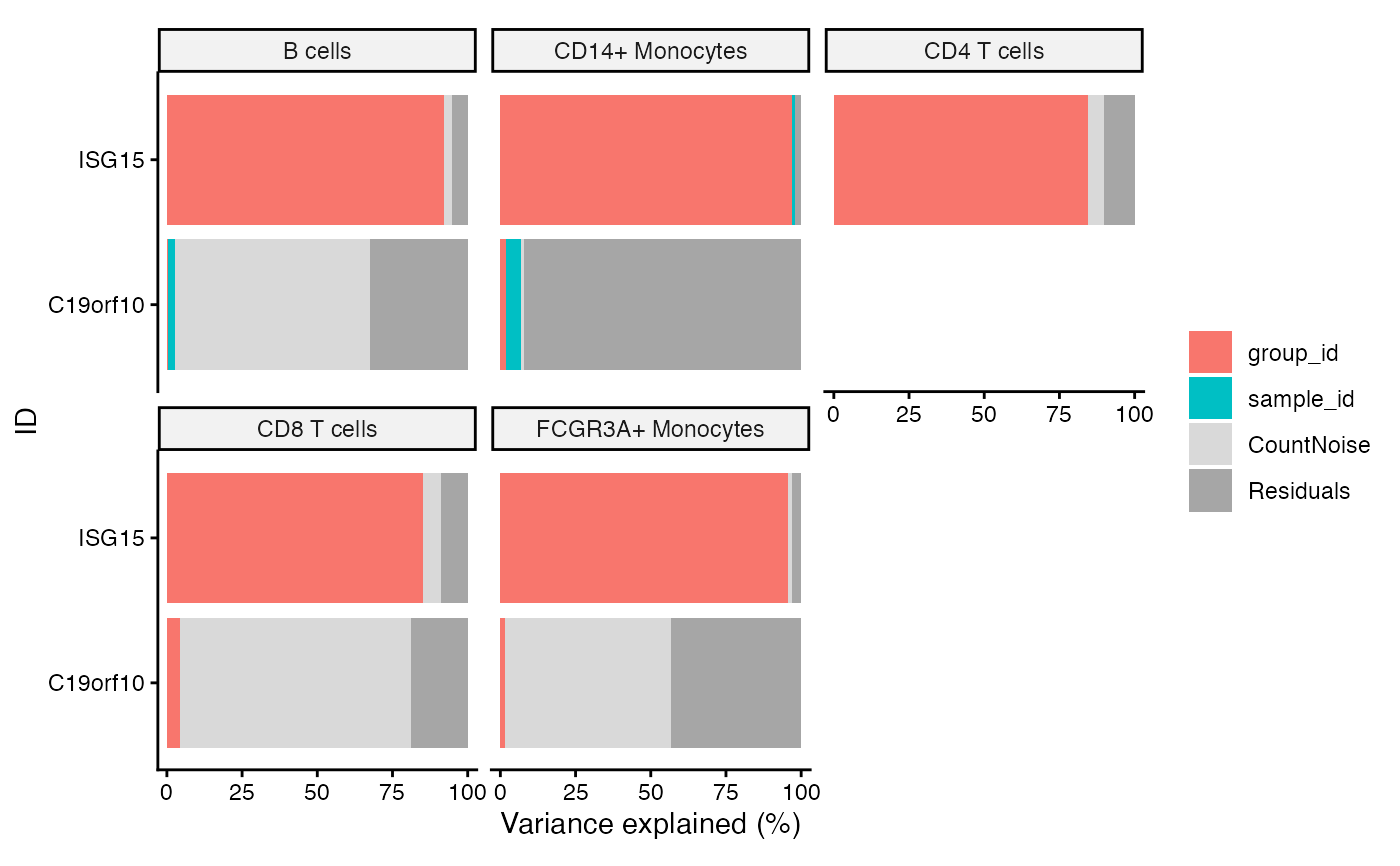
Bar plot of variance fraction for each gene and each variable
Usage
plotPercentBars(
  x,
  col = c(ggColorHue(base::ncol(x) - 4), "grey85", "grey65"),
  ncol = 3,
  cluster_ids = unique(x[["cluster_id"]]),
  ...
)

# S4 method for class 'data.frame'
plotPercentBars(
  x,
  col = c(ggColorHue(base::ncol(x) - 4), "grey85", "grey65"),
  ncol = 3,
  cluster_ids = unique(x[["cluster_id"]]),
  ...
)
Arguments
- x
object returned by
fitVarPart()- col
vector of colors
- ncol
number of columns in the plot
- cluster_ids
which cell types to plot
- ...
additional arguments
Examples
library(SingleCellExperiment)

# Load example data
data(example_sce, package="muscat")
sce <- example_sce

# Compute library size for each cell
sce$libSize <- colSums(counts(sce))

# Specify regression formula and cell annotation
form <- ~ group_id + (1|sample_id)
fit <- lucida(sce, form, "cluster_id", verbose=FALSE)
#> B cells
#> CD14+ Monocytes
#> CD4 T cells
#> CD8 T cells
#> FCGR3A+ Monocytes

# Model with only intercept and random effect
form <- ~ (1|sample_id)
fit.null <- lucida(sce, form, "cluster_id", verbose=FALSE)
#> B cells
#> CD14+ Monocytes
#> CD4 T cells
#> CD8 T cells
#> FCGR3A+ Monocytes

# Variance partitioning analysis
vp <- fitVarPart(fit, fit.null)

# Bar plots of a subset of genes
library(dplyr)
#>
#> Attaching package: ‘dplyr’
#> The following object is masked from ‘package:Biobase’:
#>
#>     combine
#> The following objects are masked from ‘package:GenomicRanges’:
#>
#>     intersect, setdiff, union
#> The following object is masked from ‘package:Seqinfo’:
#>
#>     intersect
#> The following objects are masked from ‘package:IRanges’:
#>
#>     collapse, desc, intersect, setdiff, slice, union
#> The following objects are masked from ‘package:S4Vectors’:
#>
#>     first, intersect, rename, setdiff, setequal, union
#> The following objects are masked from ‘package:BiocGenerics’:
#>
#>     combine, intersect, setdiff, setequal, union
#> The following object is masked from ‘package:generics’:
#>
#>     explain
#> The following object is masked from ‘package:matrixStats’:
#>
#>     count
#> The following objects are masked from ‘package:stats’:
#>
#>     filter, lag
#> The following objects are masked from ‘package:base’:
#>
#>     intersect, setdiff, setequal, union
vp %>%
  sortCols %>%
  filter(ID %in% c('ISG15', 'C19orf10')) %>%
  plotPercentBars