Sort columns returned by extractVarPart() or fitExtractVarPartModel()
Usage
sortCols(
  x,
  FUN = median,
  decreasing = TRUE,
  last = c("Residuals", "Measurement.error"),
  ...
)

# S4 method for class 'matrix'
sortCols(
  x,
  FUN = median,
  decreasing = TRUE,
  last = c("Residuals", "Measurement.error"),
  ...
)

# S4 method for class 'data.frame'
sortCols(
  x,
  FUN = median,
  decreasing = TRUE,
  last = c("Residuals", "Measurement.error"),
  ...
)

# S4 method for class 'varPartResults'
sortCols(
  x,
  FUN = median,
  decreasing = TRUE,
  last = c("Residuals", "Measurement.error"),
  ...
)
Arguments
- x
object returned by
extractVarPart()orfitExtractVarPartModel()- FUN
function giving summary statistic to sort by. Defaults to median
- decreasing
logical. Should the sorting be increasing or decreasing?
- last
columns to be placed on the right, regardless of values in these columns
- ...
other arguments to sort
Examples
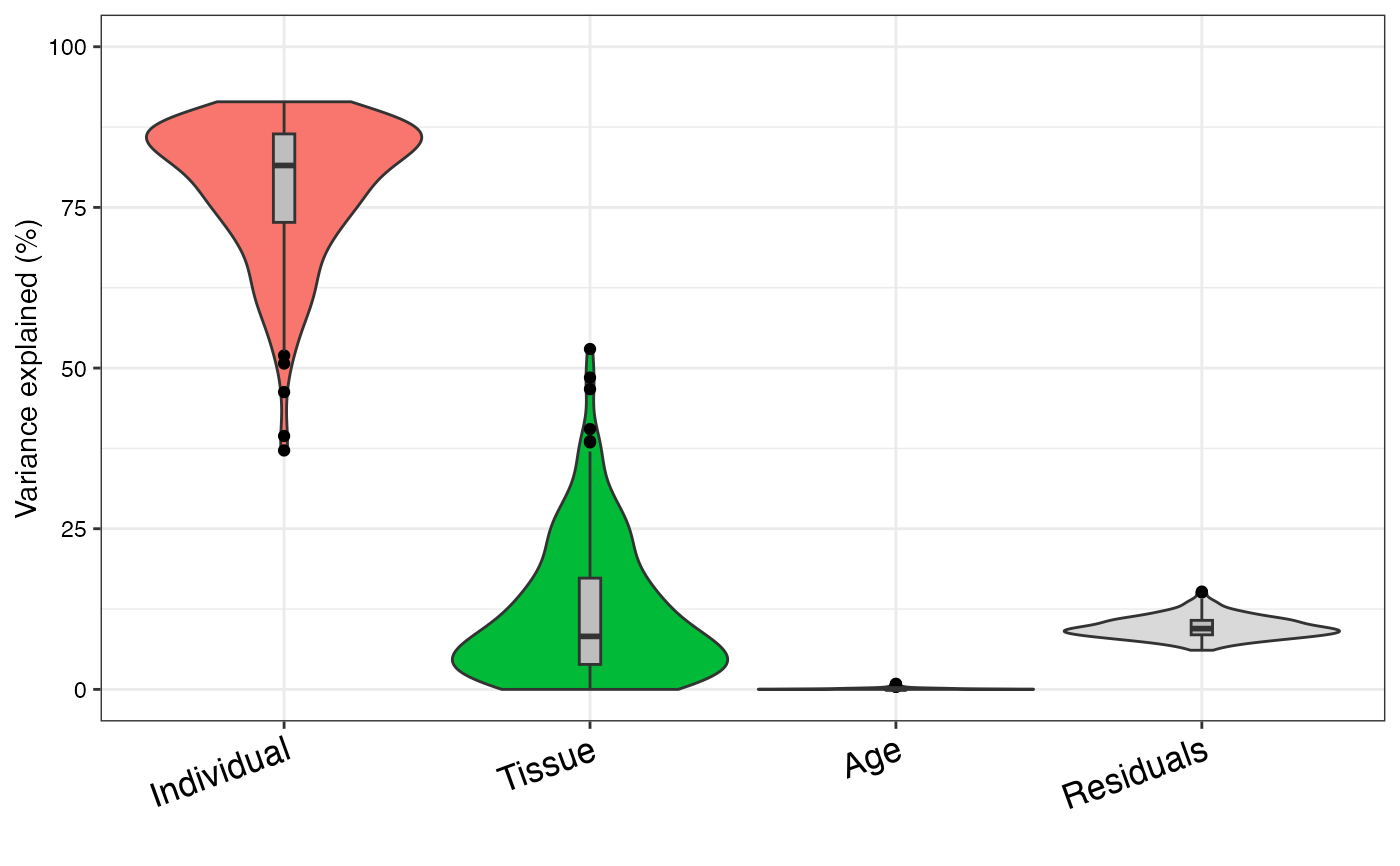
# library(variancePartition)

library(BiocParallel)

# load simulated data:
# geneExpr: matrix of gene expression values
# info: information/metadata about each sample
data(varPartData)

# Specify variables to consider
# Age is continuous so we model it as a fixed effect
# Individual and Tissue are both categorical, so we model them as random effects
form <- ~ Age + (1 | Individual) + (1 | Tissue)

# Step 1: fit linear mixed model on gene expression
# If categorical variables are specified, a linear mixed model is used
# If all variables are modeled as continuous, a linear model is used
# each entry in results is a regression model fit on a single gene
# Step 2: extract variance fractions from each model fit
# for each gene, returns fraction of variation attributable to each variable
# Interpretation: the variance explained by each variable
# after correction for all other variables
varPart <- fitExtractVarPartModel(geneExpr, form, info)

# violin plot of contribution of each variable to total variance
# sort columns by median value
plotVarPart(sortCols(varPart))