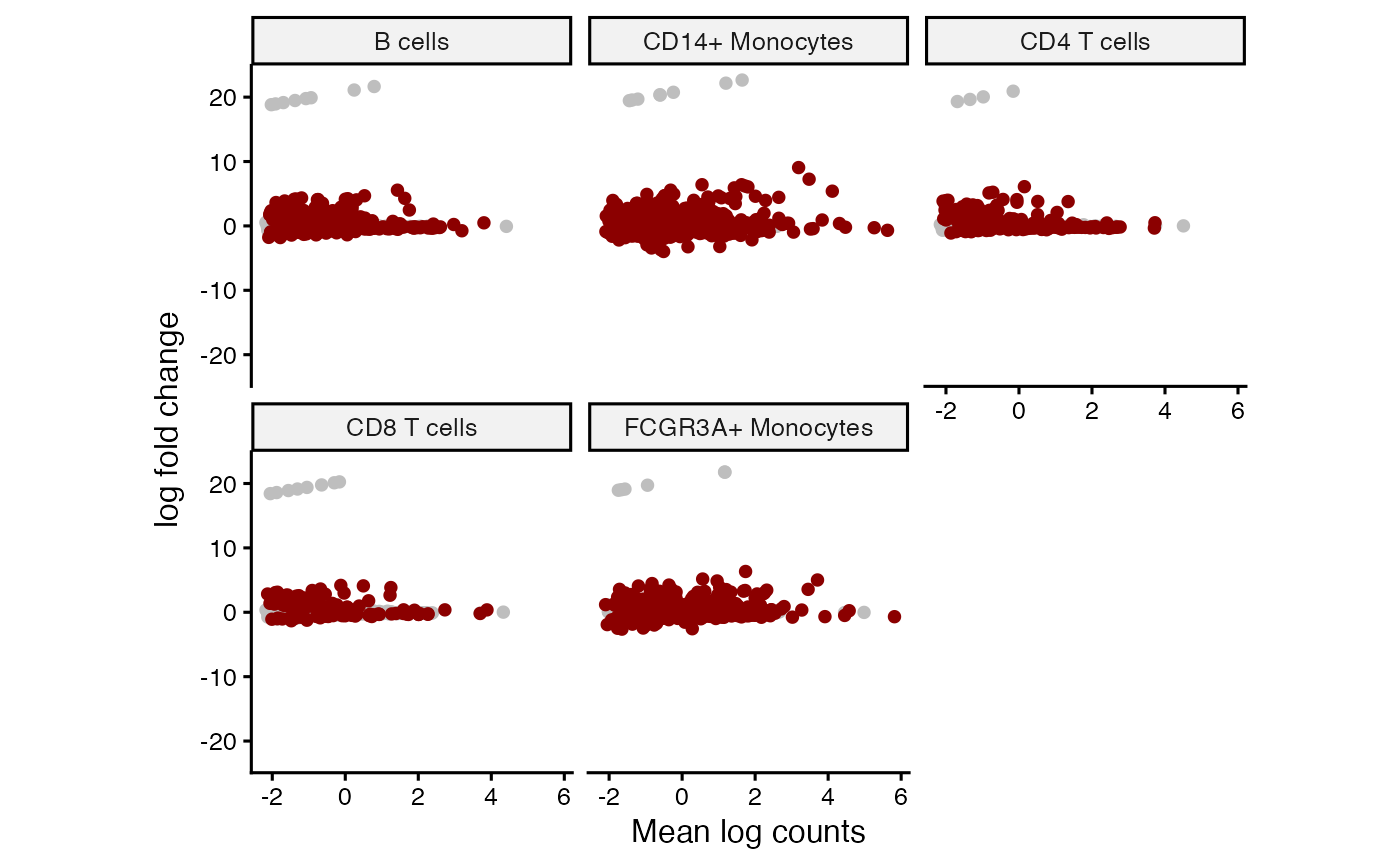
MA Plot of LogFC Versus Mean Expression
Arguments
- object
result from
lucida()- coef
coefficient to test with
results()- method
"classic": multiple testing correction using Benjamini–Hochberg method, or "Bayesian": shrink coefficient estimates and report local FDR from
ashr::ash()using empirical Bayes approach.- size
text size
- ymax
maximum value to show on the y-axis. if
NULLset to max observed value- cutoff
adj.P.Val cutoff to distinguish significant from non-significant genes
- ncol
number of columns in the plot
- cluster_ids
which assays to plot
- ...
arguments passed to
facet_wrap(). Useful for specifyingscales = "free_y"
Examples
library(SingleCellExperiment)

# Load example data
data(example_sce, package="muscat")
sce <- example_sce

# Compute library size for each cell
sce$libSize <- colSums(counts(sce))

# Specify regression formula and cell annotation
form <- ~ group_id
fit <- lucida(sce, form, "cluster_id", verbose=FALSE)
#> B cells
#> CD14+ Monocytes
#> CD4 T cells
#> CD8 T cells
#> FCGR3A+ Monocytes

# MA plot
plotMA(fit, "group_idstim")