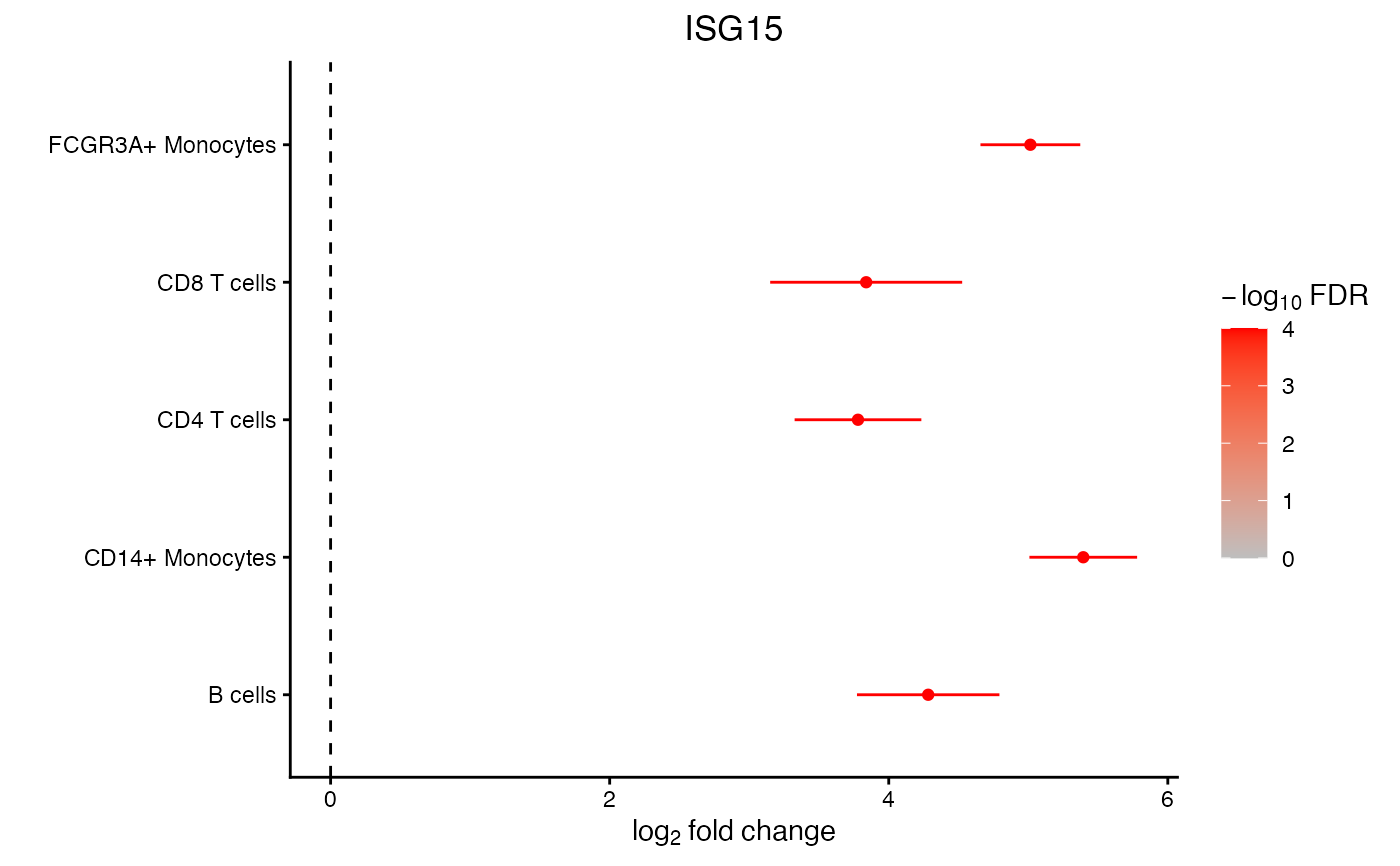
Skip to contents

Plot forest

Usage

plotForest(x, gene, coef, ...)

# S4 method for class 'lucida'
plotForest(
  x,
  gene,
  coef,
  cluster_ids = names(x),
  method = c("classic", "Bayesian"),
  ylim = NULL
)

Arguments

x

result from lucida()

gene

gene to show results for

coef

coefficient to test with results()

...

other arguments

cluster_ids

array of cell types to plot

method

"classic": multiple testing correction using Benjamini–Hochberg method, or "Bayesian": shrink coefficient estimates and report local FDR from ashr::ash() using empirical Bayes approach

ylim

limits for the y axis

Examples

library(SingleCellExperiment)

# Load example data
data(example_sce, package="muscat")
sce <- example_sce

# Compute library size for each cell
sce$libSize <- colSums(counts(sce))

# Specify regression formula and cell annotation 
form <- ~ group_id 
fit <- lucida(sce, form, "cluster_id", verbose=FALSE)
#> B cells 
#> 
  |                                                              |   0%, ETA NA
  |=======================================================| 100%, Elapsed 00:00
#> 
  |                                                              |   0%, ETA NA
  |=======================================================| 100%, Elapsed 00:00
#> CD14+ Monocytes 
#> 
  |                                                              |   0%, ETA NA
  |=======================================================| 100%, Elapsed 00:00
#> 
  |                                                              |   0%, ETA NA
  |=======================================================| 100%, Elapsed 00:00
#> CD4 T cells 
#> 
  |                                                              |   0%, ETA NA
  |=======================================================| 100%, Elapsed 00:00
#> 
  |                                                              |   0%, ETA NA
  |=======================================================| 100%, Elapsed 00:00
#> CD8 T cells 
#> 
  |                                                              |   0%, ETA NA
  |=======================================================| 100%, Elapsed 00:00
#> 
  |                                                              |   0%, ETA NA
  |=======================================================| 100%, Elapsed 00:00
#> FCGR3A+ Monocytes 
#> 
  |                                                              |   0%, ETA NA
  |=======================================================| 100%, Elapsed 00:00
#> 
  |                                                              |   0%, ETA NA
  |=======================================================| 100%, Elapsed 00:00

# Forest plot of differential expression results
plotForest(fit, coef="group_idstim", gene = "ISG15" )