Skip to contents

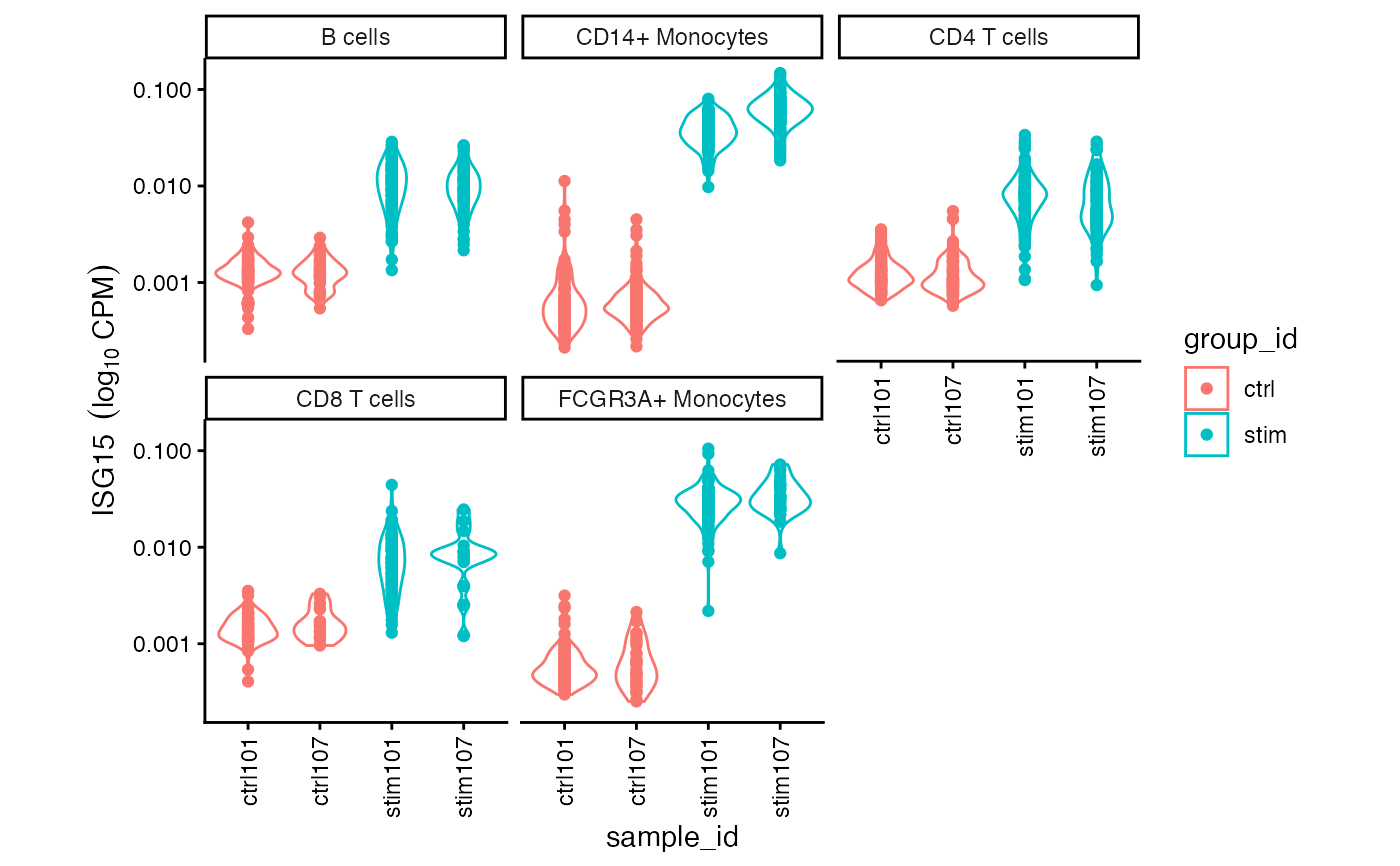
Plot expression stratified by cell type and trait

Usage

plotExpression(
  sce,
  gene,
  sample_id,
  cluster_id,
  group_id,
  cluster_ids = unique(sce[[cluster_id]])
)

Arguments

sce

SingleCellExperiment object

gene

row of sce to plot

sample_id

column of sce storing sample identifier

cluster_id

column of sce storing cell type

group_id

column of sce group identifier

cluster_ids

array of cell types to plot

Examples

library(SingleCellExperiment)

# Load example data
data(example_sce, package="muscat")
sce <- example_sce

# Compute library size for each cell
sce$libSize <- colSums(counts(sce))

# Specify regression formula and cell annotation 
form <- ~ group_id 
fit <- lucida(sce, form, "cluster_id", verbose=FALSE)
#> B cells 
#> 
  |                                                              |   0%, ETA NA
  |=======================================================| 100%, Elapsed 00:00
#> 
  |                                                              |   0%, ETA NA
  |=======================================================| 100%, Elapsed 00:00
#> CD14+ Monocytes 
#> 
  |                                                              |   0%, ETA NA
  |=======================================================| 100%, Elapsed 00:00
#> 
  |                                                              |   0%, ETA NA
  |=======================================================| 100%, Elapsed 00:00
#> CD4 T cells 
#> 
  |                                                              |   0%, ETA NA
  |=======================================================| 100%, Elapsed 00:00
#> 
  |                                                              |   0%, ETA NA
  |=======================================================| 100%, Elapsed 00:00
#> CD8 T cells 
#> 
  |                                                              |   0%, ETA NA
  |=======================================================| 100%, Elapsed 00:00
#> 
  |                                                              |   0%, ETA NA
  |=======================================================| 100%, Elapsed 00:00
#> FCGR3A+ Monocytes 
#> 
  |                                                              |   0%, ETA NA
  |=======================================================| 100%, Elapsed 00:00
#> 
  |                                                              |   0%, ETA NA
  |=======================================================| 100%, Elapsed 00:00

# Expression plot
plotExpression( sce, "ISG15", "sample_id", "cluster_id", "group_id")