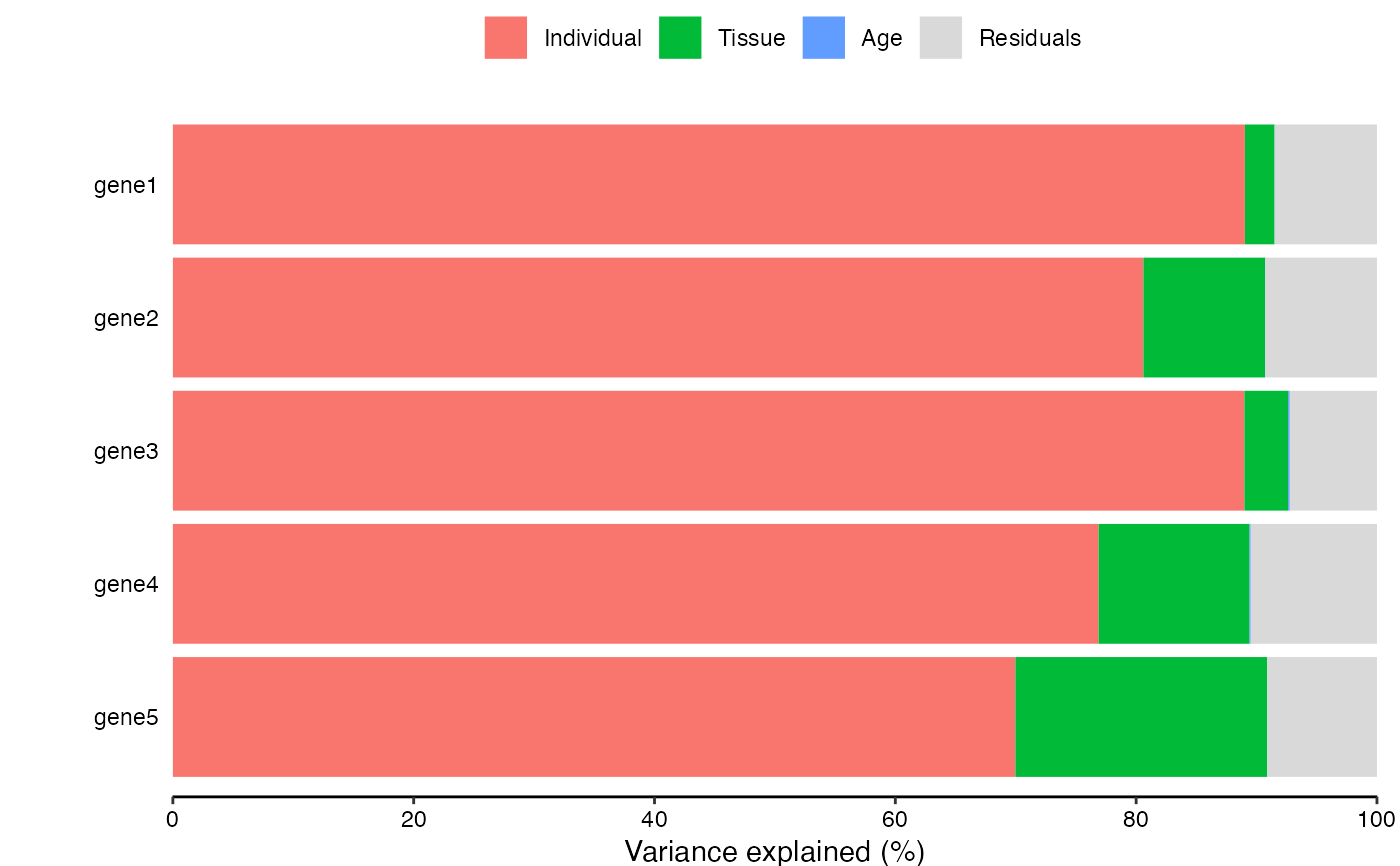
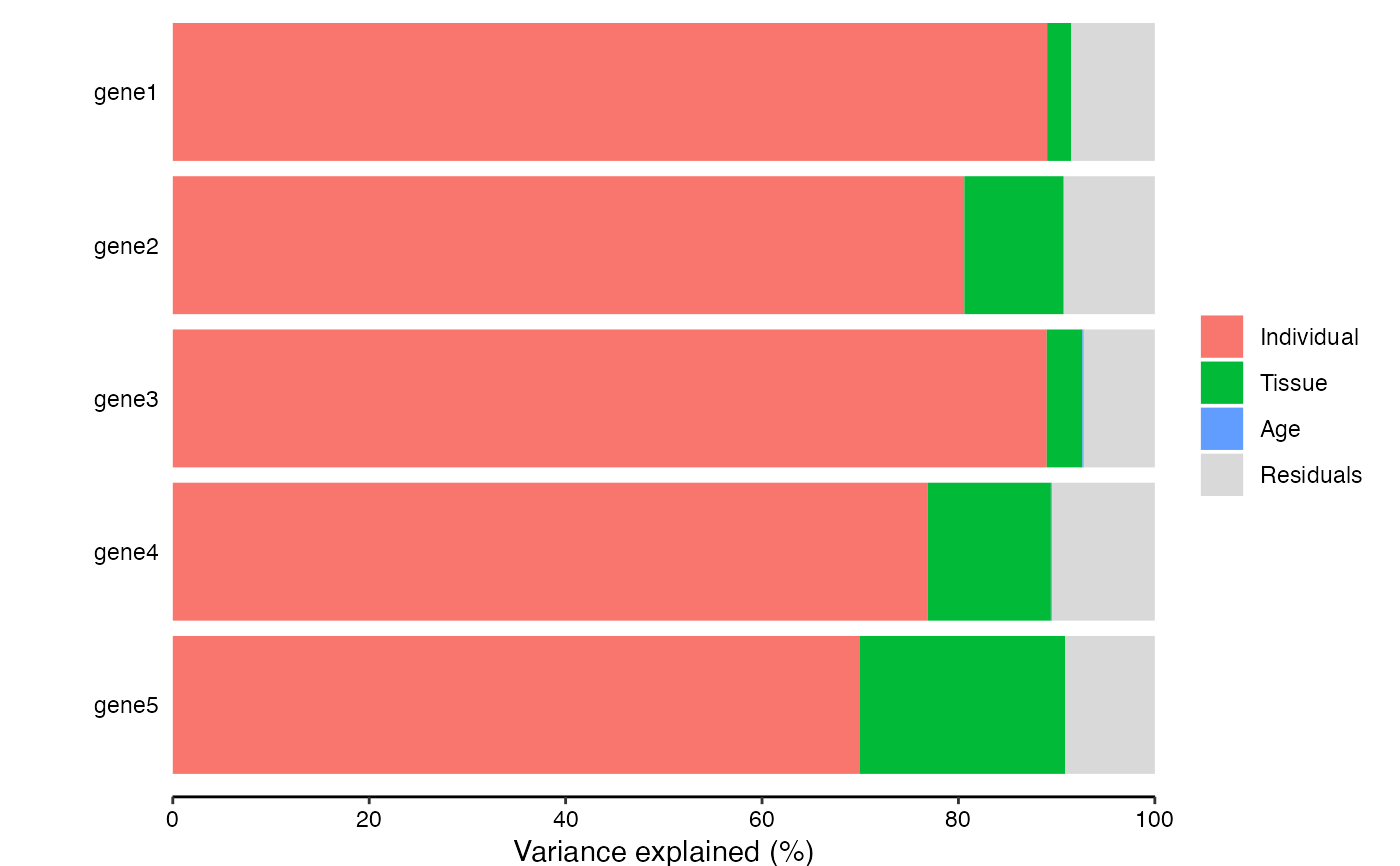
Bar plot of fractions for a subset of genes
Usage
plotPercentBars(
  x,
  col = c(ggColorHue(ncol(x) - 1), "grey85"),
  genes = rownames(x),
  width = NULL,
  ...
)

# S4 method for class 'matrix'
plotPercentBars(
  x,
  col = c(ggColorHue(ncol(x) - 1), "grey85"),
  genes = rownames(x),
  width = NULL,
  ...
)

# S4 method for class 'data.frame'
plotPercentBars(
  x,
  col = c(ggColorHue(ncol(x) - 1), "grey85"),
  genes = rownames(x),
  width = NULL,
  ...
)

# S4 method for class 'varPartResults'
plotPercentBars(
  x,
  col = c(ggColorHue(ncol(x) - 1), "grey85"),
  genes = rownames(x),
  width = NULL,
  ...
)Examples
# library(variancePartition)

library(BiocParallel)

# load simulated data:
# geneExpr: matrix of gene expression values
# info: information/metadata about each sample
data(varPartData)

# Specify variables to consider
form <- ~ Age + (1 | Individual) + (1 | Tissue)

# Fit model
varPart <- fitExtractVarPartModel(geneExpr, form, info)

# Bar plot for a subset of genes showing variance fractions
plotPercentBars(varPart[1:5, ])


# Move the legend to the top
plotPercentBars(varPart[1:5, ]) + theme(legend.position = "top")
# Move the legend to the top
plotPercentBars(varPart[1:5, ]) + theme(legend.position = "top")