Given covariance between features in the original data, estimate the covariance matrix after applying a transformation to each feature. Here we use the eclairs decomposition of the original covariance matrix, perform a parametric bootstrap and return the eclairs decomposition of the covariance matrix of the transformed data.
Usage
cov_transform(
  ecl,
  f,
  n.boot,
  lambda = NULL,
  compute = c("covariance", "correlation"),
  seed = NULL
)
Arguments
- ecl
covariance/correlation matrix as an eclairs object
- f
function specifying the transformation.
- n.boot
number of parametric bootstrap samples. Increasing n gives more precise estimates.
- lambda
shrinkage parameter. If not specified, it is estimated from the data.
- compute
evaluate either the
"covariance"or"correlation"ofX- seed
If you want the same to be generated again use a seed for the generator, an integer number
Value
eclairs decomposition representing correlation/covariance on the transformed data
Examples
library(Rfast)
n <- 800 # number of samples
p <- 200 # number of features
# create correlation matrix
Sigma <- autocorr.mat(p, .9)
# sample matrix from MVN with covariance Sigma
Y <- rmvnorm(n, rep(0, p), sigma = Sigma, seed = 1)
# perform eclairs decomposition
ecl <- eclairs(Y)
# Parametric boostrap to estimate covariance
# after transformation
# transformation function
f <- function(x) log(x^2 + 1e-3)
# number of bootstrap samples
n_boot <- 10000
# Evaluate eclairs decomposition on boostrap samples
ecl2 <- cov_transform(ecl, f = f, n_boot, lambda = 1e-4)
# Get full covariance matrix from eclairs decomposition
C1 <- getCov(ecl2)
# Parametric boostrap samples directly from full covariance matrix
X <- rmvnorm(n_boot, rep(0, p), getCov(ecl))
# get covariance of transformed data
C2 <- cov(f(X))
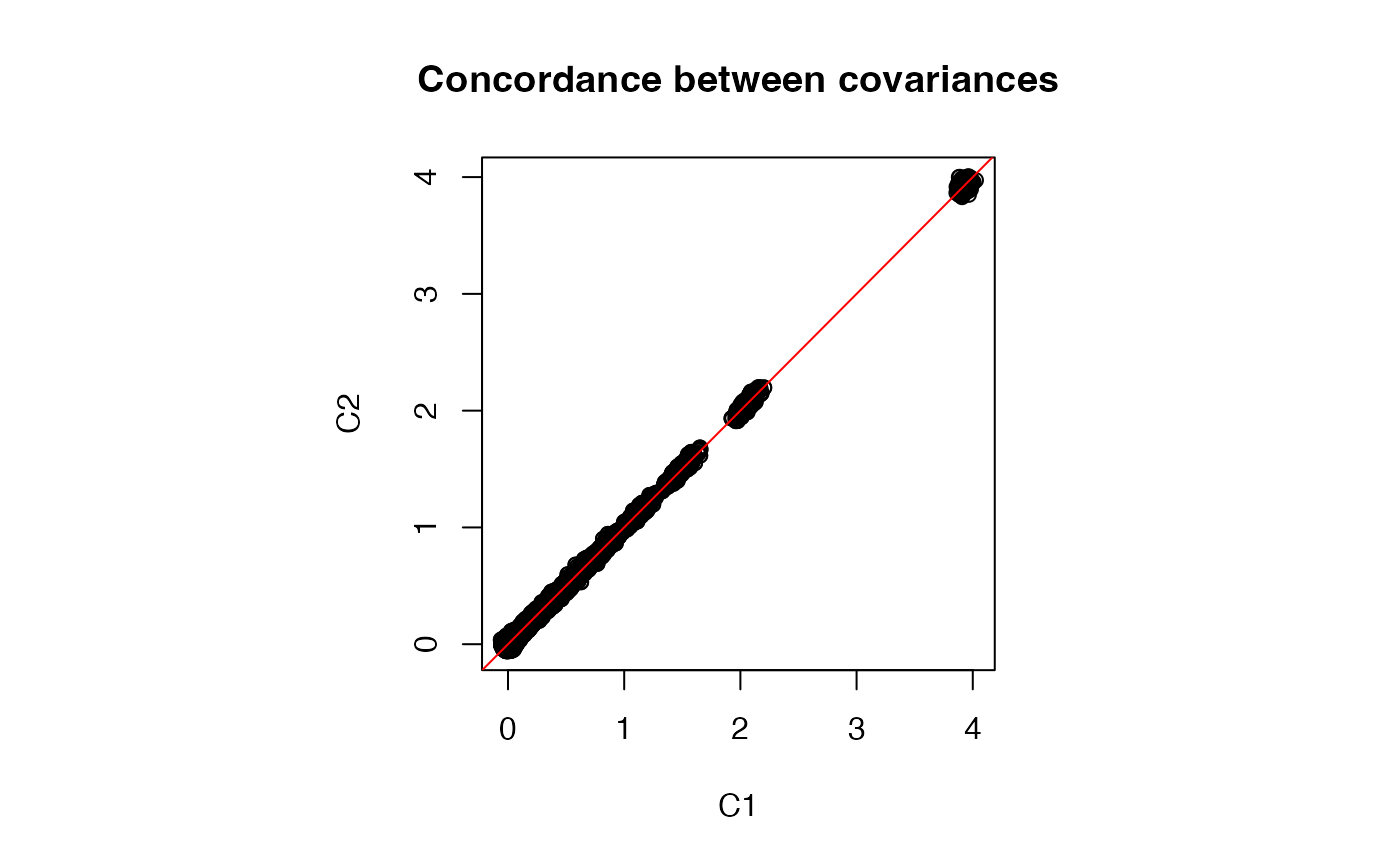
# Evaluate differences
# small differences are due to Monte Carlo error from boostrap sampling
range(C1 - C2)
#> [1] -0.2848793 0.2271215
# Plot entries from two covariance estimates
par(pty = "s")
plot(C1, C2, main = "Concordance between covariances")
abline(0, 1, col = "red")
 # Same above but compute eclairs for correlation matrix
#-------------------------------------------------------
# Evaluate eclairs decomposition on boostrap samples
ecl2 <- cov_transform(ecl, f = f, n_boot, compute = "correlation", lambda = 1e-4)
# Get full covariance matrix from eclairs decomposition
C1 <- getCor(ecl2)
# Parametric boostrap samples directly from full covariance matrix
X <- rmvnorm(n_boot, rep(0, p), getCov(ecl))
# get correlation of transformed data
C2 <- cor(f(X))
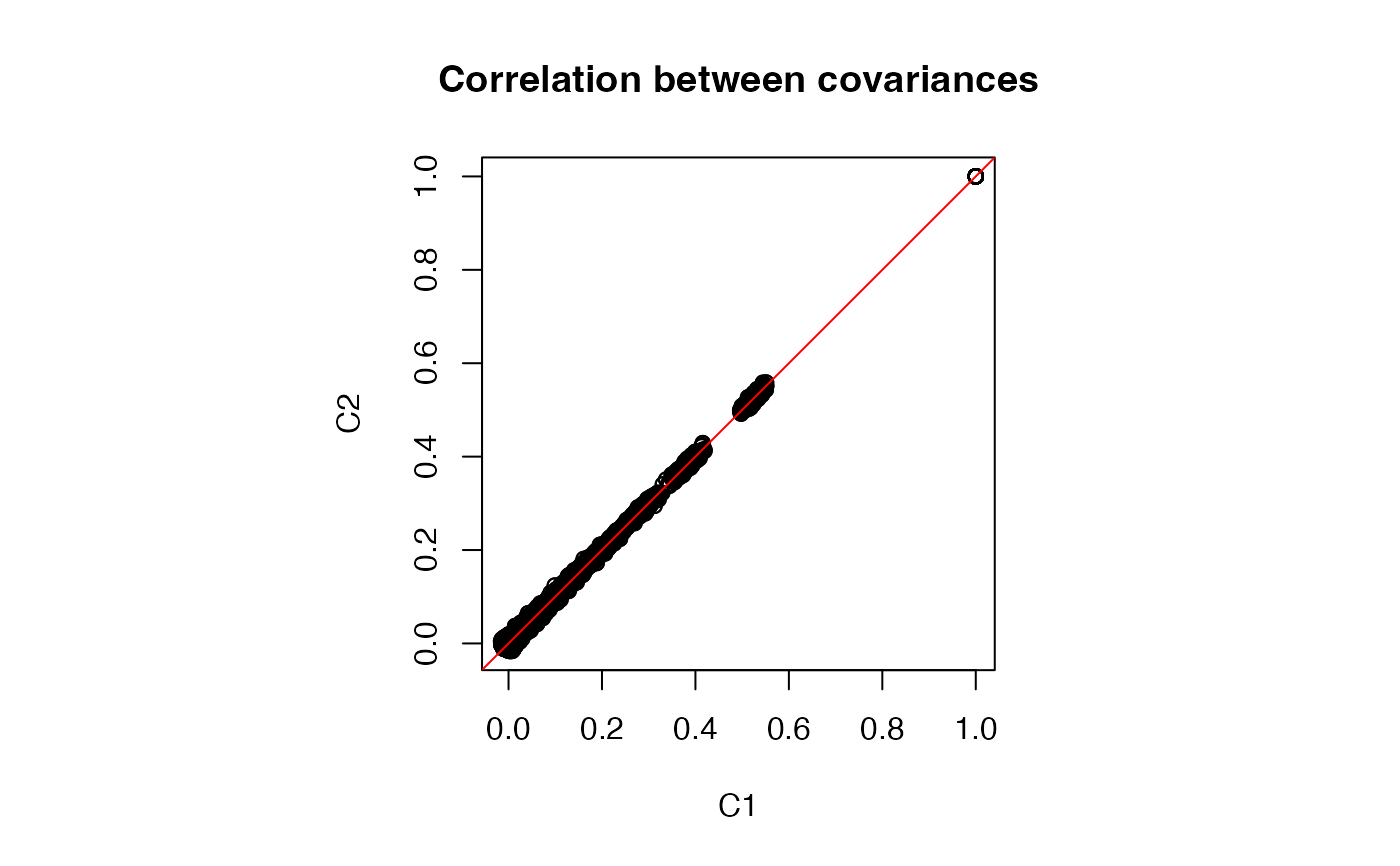
# Evaluate differences
# small differences are due to Monte Carlo error from boostrap sampling
range(C1 - C2)
#> [1] -0.05196113 0.05090019
# Plot entries from two correlation estimates
par(pty = "s")
plot(C1, C2, main = "Correlation between covariances")
abline(0, 1, col = "red")
# Same above but compute eclairs for correlation matrix
#-------------------------------------------------------
# Evaluate eclairs decomposition on boostrap samples
ecl2 <- cov_transform(ecl, f = f, n_boot, compute = "correlation", lambda = 1e-4)
# Get full covariance matrix from eclairs decomposition
C1 <- getCor(ecl2)
# Parametric boostrap samples directly from full covariance matrix
X <- rmvnorm(n_boot, rep(0, p), getCov(ecl))
# get correlation of transformed data
C2 <- cor(f(X))
# Evaluate differences
# small differences are due to Monte Carlo error from boostrap sampling
range(C1 - C2)
#> [1] -0.05196113 0.05090019
# Plot entries from two correlation estimates
par(pty = "s")
plot(C1, C2, main = "Correlation between covariances")
abline(0, 1, col = "red")