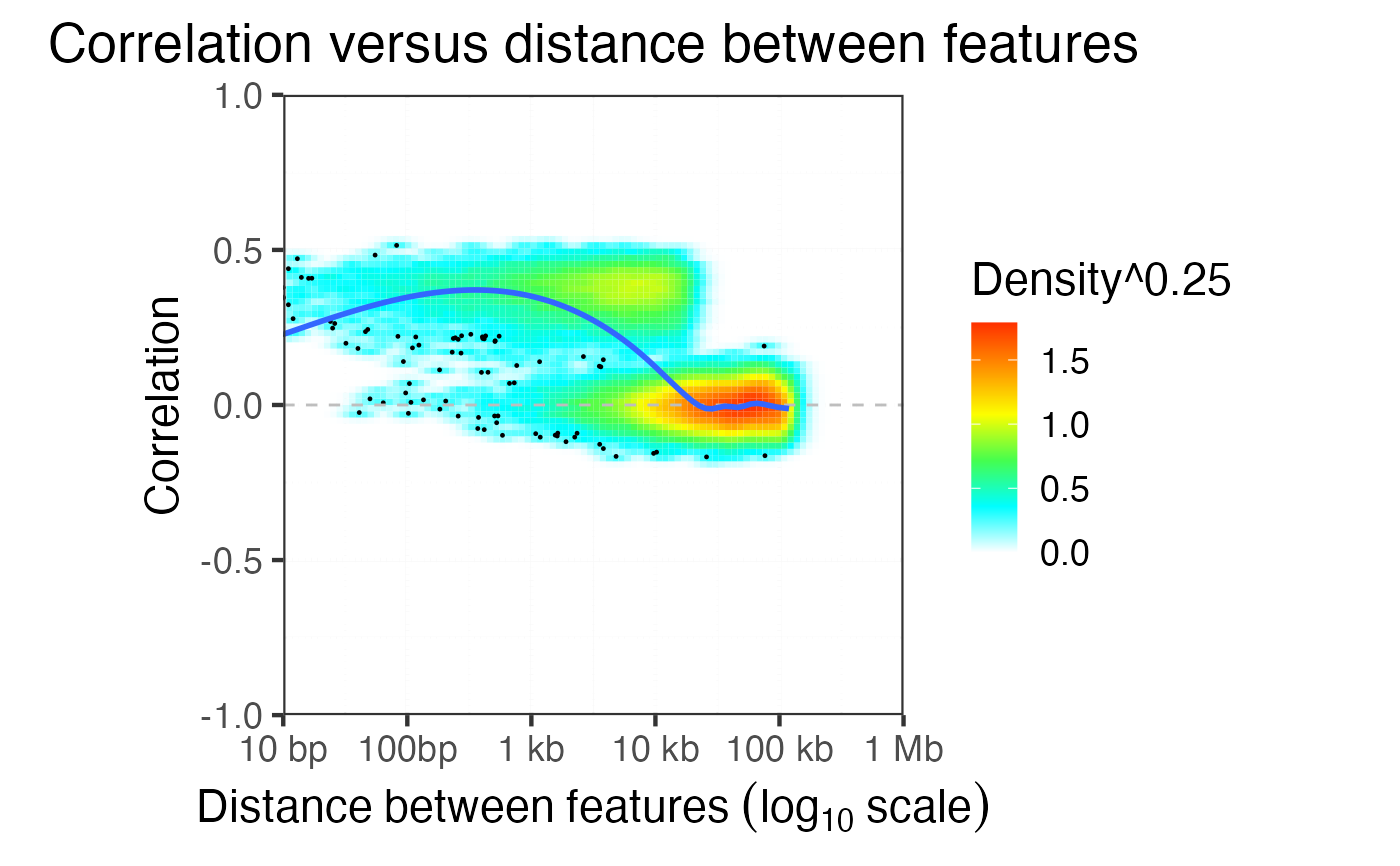
Plot correlation delay using subsampling
Arguments
- dfDist
data.frame of distance and correlation from from evaluateCorrDecay()
- method
on show either R or Rsq on y-axis
- xlim
min and max values for x-axis
- n
the number of equally spaced points at which the density is to be estimated.
- outlierQuantile
show points if density is less than this quantile
- densityExponent
color based on density^densityExponent
Details
Plot correlation versus log10 distance. Sample equal number of points for each bin along the x-axis.
Examples
library(GenomicRanges)
library(ggplot2)

data('decorateData')

# Evaluate hierarchical clustering
treeList = runOrderedClusteringGenome( simData, simLocation )
#>
Evaluating:chr20
#>

# Evaluate how correlation between features decays with distance
dfDist = evaluateCorrDecay( treeList, simLocation )
#>
chr20
#>

# make plot
plotCorrDecay( dfDist )
#> Scale for y is already present.
#> Adding another scale for y, which will replace the existing scale.
#> Scale for x is already present.
#> Adding another scale for x, which will replace the existing scale.
#> Warning: Removed 23 rows containing non-finite values (`stat_density2d()`).
#> `geom_smooth()` using method = 'gam' and formula = 'y ~ s(x, bs = "cs")'
#> Warning: Removed 23 rows containing non-finite values (`stat_smooth()`).
#> Warning: Removed 396 rows containing missing values (`geom_tile()`).
#> Warning: Removed 15 rows containing missing values (`geom_point()`).
