Integration with dreamlet / SingleCellExperiment
Developed by Gabriel Hoffman
Run on 2025-08-11 14:19:51.385562
Source:vignettes/integration.Rmd
integration.RmdLoad and process single cell data
Here we perform analysis of PBMCs from 8 individuals stimulated with
interferon-β Kang, et
al, 2018, Nature Biotech. We perform standard processing with dreamlet
to compute pseudobulk before applying crumblr.
Here, single cell RNA-seq data is downloaded from ExperimentHub.
library(dreamlet)
library(muscat)
library(ExperimentHub)
library(scater)

# Download data, specifying EH2259 for the Kang, et al. study
eh <- ExperimentHub()
sce <- eh[["EH2259"]]

sce$ind <- as.character(sce$ind)

# only keep singlet cells with sufficient reads
sce <- sce[rowSums(counts(sce) > 0) > 0, ]
sce <- sce[, colData(sce)$multiplets == "singlet"]

# compute QC metrics
qc <- perCellQCMetrics(sce)

# remove cells with few or many detected genes
ol <- isOutlier(metric = qc$detected, nmads = 2, log = TRUE)
sce <- sce[, !ol]

# set variable indicating stimulated (stim) or control (ctrl)
sce$StimStatus <- sce$stim
Aggregate to pseudobulk
Dreamlet creates the pseudobulk dataset:
# Since 'ind' is the individual and 'StimStatus' is the stimulus status,
# create unique identifier for each sample
sce$id <- paste0(sce$StimStatus, sce$ind)

# Create pseudobulk data by specifying cluster_id and sample_id for aggregating cells
pb <- aggregateToPseudoBulk(sce,
  assay = "counts",
  cluster_id = "cell",
  sample_id = "id",
  verbose = FALSE
)
Process data
Here we evaluate whether the observed cell proportions change in response to interferon-β.
library(crumblr)

# use dreamlet::cellCounts() to extract data
cellCounts(pb)[1:3, 1:3]
## B cells CD14+ Monocytes CD4 T cells
## ctrl101 101 136 288
## ctrl1015 424 644 819
## ctrl1016 119 315 413
# Apply crumblr transformation
# cobj is an EList object compatable with limma workflow
# cobj$E stores transformed values
# cobj$weights stores precision weights
cobj <- crumblr(cellCounts(pb))
Analysis
Now continue on with the downstream analysis
library(variancePartition)

fit <- dream(cobj, ~ StimStatus + ind, colData(pb))
fit <- eBayes(fit)

topTable(fit, coef = "StimStatusstim", number = Inf)
## logFC AveExpr t P.Value adj.P.Val B
## CD8 T cells -0.25085170 0.0857175 -4.0787416 0.002436375 0.01949100 -1.279815
## Dendritic cells 0.37386979 -2.1849234 3.1619195 0.010692544 0.02738587 -2.638507
## CD14+ Monocytes -0.10525402 1.2698117 -3.1226341 0.011413912 0.02738587 -2.709377
## B cells -0.10478652 0.5516882 -3.0134349 0.013692935 0.02738587 -2.940542
## CD4 T cells -0.07840101 2.0201947 -2.2318104 0.050869691 0.08139151 -4.128069
## FCGR3A+ Monocytes 0.07425165 -0.2567492 1.6647681 0.128337022 0.17111603 -4.935304
## NK cells 0.10270672 0.3797777 1.5181860 0.161321761 0.18436773 -5.247806
## Megakaryocytes 0.01377768 -1.8655172 0.1555131 0.879651456 0.87965146 -6.198336Given the results here, we see that CD8 T cells at others change relative abundance following treatment with interferon-β.
Multivariate testing along a tree
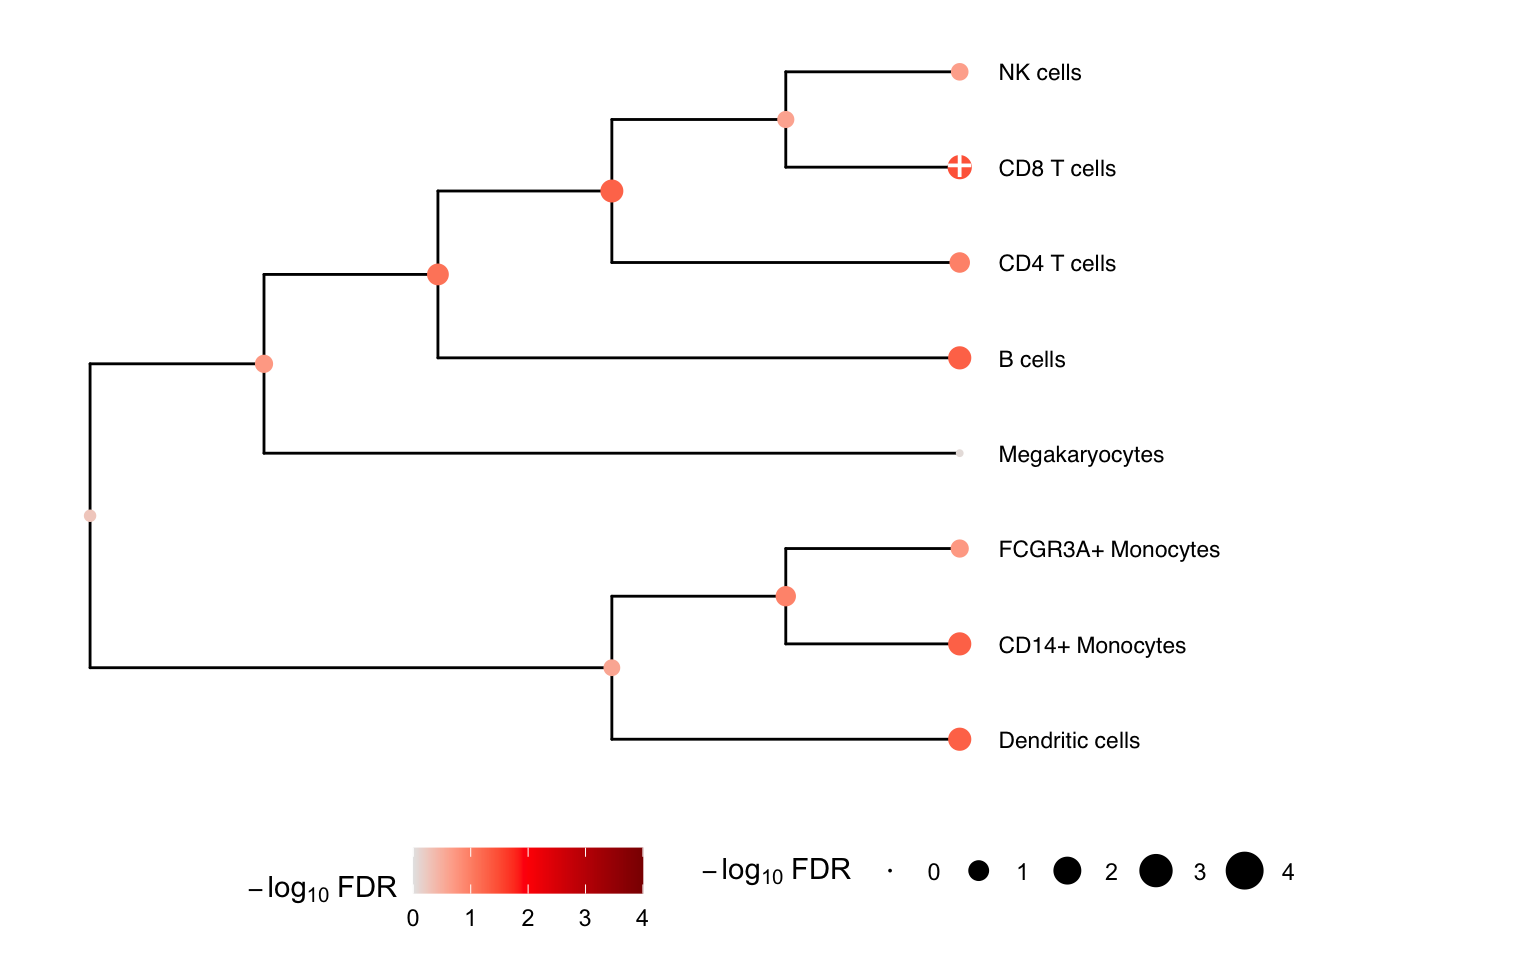
ere we construct a hierarchical clustering between cell types based
on gene expression from pseudobulk, and perform a multivariate test for
each internal node of the tree based on its leaf nodes. The results for
the leaves are the same as from topTable() above.
# hierarchical cluster based on pseudobulked gene expression
hcl <- buildClusterTreeFromPB(pb)

# Perform multivariate test across the hierarchy
res <- treeTest(fit, cobj, hcl, coef = "StimStatusstim")

# Plot hierarchy and testing results
plotTreeTest(res)
Session Info
## R version 4.5.1 (2025-06-13)
## Platform: aarch64-apple-darwin23.6.0
## Running under: macOS Sonoma 14.7.1
##
## Matrix products: default
## BLAS/LAPACK: /opt/homebrew/Cellar/openblas/0.3.30/lib/libopenblasp-r0.3.30.dylib;  LAPACK version 3.12.0
##
## locale:
## [1] en_US.UTF-8/en_US.UTF-8/en_US.UTF-8/C/en_US.UTF-8/en_US.UTF-8
##
## time zone: America/New_York
## tzcode source: internal
##
## attached base packages:
## [1] stats4    stats     graphics  grDevices utils     datasets  methods   base
##
## other attached packages:
##  [1] crumblr_0.99.22             muscData_1.22.0             scater_1.36.0
##  [4] scuttle_1.18.0              ExperimentHub_2.16.1        AnnotationHub_3.16.1
##  [7] BiocFileCache_2.16.1        dbplyr_2.5.0                muscat_1.22.0
## [10] dreamlet_1.6.0              SingleCellExperiment_1.30.1 SummarizedExperiment_1.38.1
## [13] Biobase_2.68.0              GenomicRanges_1.60.0        GenomeInfoDb_1.44.1
## [16] IRanges_2.42.0              S4Vectors_0.46.0            BiocGenerics_0.54.0
## [19] generics_0.1.4              MatrixGenerics_1.20.0       matrixStats_1.5.0
## [22] variancePartition_1.37.4    BiocParallel_1.42.1         limma_3.64.3
## [25] ggplot2_3.5.2               BiocStyle_2.36.0
##
## loaded via a namespace (and not attached):
##   [1] fs_1.6.6                  bitops_1.0-9              httr_1.4.7
##   [4] RColorBrewer_1.1-3        doParallel_1.0.17         Rgraphviz_2.52.0
##   [7] numDeriv_2016.8-1.1       tools_4.5.1               sctransform_0.4.2
##  [10] backports_1.5.0           R6_2.6.1                  metafor_4.8-0
##  [13] lazyeval_0.2.2            mgcv_1.9-3                GetoptLong_1.0.5
##  [16] withr_3.0.2               prettyunits_1.2.0         gridExtra_2.3
##  [19] cli_3.6.5                 textshaping_1.0.1         labeling_0.4.3
##  [22] sass_0.4.10               KEGGgraph_1.68.0          SQUAREM_2021.1
##  [25] mvtnorm_1.3-3             blme_1.0-6                pkgdown_2.1.3
##  [28] mixsqp_0.3-54             yulab.utils_0.2.0         systemfonts_1.2.3
##  [31] zenith_1.10.0             parallelly_1.45.1         invgamma_1.2
##  [34] RSQLite_2.4.2             gridGraphics_0.5-1        shape_1.4.6.1
##  [37] gtools_3.9.5              dplyr_1.1.4               Matrix_1.7-3
##  [40] metadat_1.4-0             ggbeeswarm_0.7.2          abind_1.4-8
##  [43] lifecycle_1.0.4           yaml_2.3.10               edgeR_4.6.3
##  [46] mathjaxr_1.8-0            gplots_3.2.0              SparseArray_1.8.1
##  [49] grid_4.5.1                blob_1.2.4                crayon_1.5.3
##  [52] lattice_0.22-7            beachmat_2.24.0           msigdbr_25.1.1
##  [55] annotate_1.86.1           KEGGREST_1.48.1           pillar_1.11.0
##  [58] knitr_1.50                ComplexHeatmap_2.24.1     rjson_0.2.23
##  [61] boot_1.3-31               corpcor_1.6.10            future.apply_1.20.0
##  [64] codetools_0.2-20          glue_1.8.0                ggfun_0.2.0
##  [67] data.table_1.17.8         treeio_1.32.0             vctrs_0.6.5
##  [70] png_0.1-8                 Rdpack_2.6.4              gtable_0.3.6
##  [73] assertthat_0.2.1          cachem_1.1.0              zigg_0.0.2
##  [76] xfun_0.52                 mime_0.13                 rbibutils_2.3
##  [79] S4Arrays_1.8.1            Rfast_2.1.5.1             reformulas_0.4.1
##  [82] iterators_1.0.14          statmod_1.5.0             nlme_3.1-168
##  [85] pbkrtest_0.5.5            ggtree_3.16.3             bit64_4.6.0-1
##  [88] filelock_1.0.3            progress_1.2.3            EnvStats_3.1.0
##  [91] bslib_0.9.0               TMB_1.9.17                irlba_2.3.5.1
##  [94] vipor_0.4.7               KernSmooth_2.23-26        colorspace_2.1-1
##  [97] rmeta_3.0                 DBI_1.2.3                 DESeq2_1.48.1
## [100] tidyselect_1.2.1          bit_4.6.0                 compiler_4.5.1
## [103] curl_6.4.0                graph_1.86.0              BiocNeighbors_2.2.0
## [106] desc_1.4.3                DelayedArray_0.34.1       bookdown_0.43
## [109] scales_1.4.0              caTools_1.18.3            remaCor_0.0.18
## [112] rappdirs_0.3.3            stringr_1.5.1             digest_0.6.37
## [115] minqa_1.2.8               rmarkdown_2.29            aod_1.3.3
## [118] XVector_0.48.0            RhpcBLASctl_0.23-42       htmltools_0.5.8.1
## [121] pkgconfig_2.0.3           lme4_1.1-37               sparseMatrixStats_1.20.0
## [124] mashr_0.2.79              fastmap_1.2.0             rlang_1.1.6
## [127] GlobalOptions_0.1.2       htmlwidgets_1.6.4         UCSC.utils_1.4.0
## [130] DelayedMatrixStats_1.30.0 farver_2.1.2              jquerylib_0.1.4
## [133] jsonlite_2.0.0            BiocSingular_1.24.0       RCurl_1.98-1.17
## [136] magrittr_2.0.3            ggplotify_0.1.2           GenomeInfoDbData_1.2.14
## [139] patchwork_1.3.1           Rcpp_1.1.0                ape_5.8-1
## [142] babelgene_22.9            viridis_0.6.5             EnrichmentBrowser_2.38.0
## [145] stringi_1.8.7             MASS_7.3-65               plyr_1.8.9
## [148] listenv_0.9.1             parallel_4.5.1            ggrepel_0.9.6
## [151] Biostrings_2.76.0         splines_4.5.1             hms_1.1.3
## [154] circlize_0.4.16           locfit_1.5-9.12           reshape2_1.4.4
## [157] ScaledMatrix_1.16.0       BiocVersion_3.21.1        XML_3.99-0.18
## [160] evaluate_1.0.4            RcppParallel_5.1.10.9000  BiocManager_1.30.26
## [163] nloptr_2.2.1              foreach_1.5.2             tidyr_1.3.1
## [166] purrr_1.1.0               future_1.67.0             clue_0.3-66
## [169] scattermore_1.2           ashr_2.2-63               rsvd_1.0.5
## [172] broom_1.0.9               xtable_1.8-4              tidytree_0.4.6
## [175] fANCOVA_0.6-1             viridisLite_0.4.2         ragg_1.4.0
## [178] truncnorm_1.0-9           tibble_3.3.0              aplot_0.2.8
## [181] lmerTest_3.1-3            glmmTMB_1.1.11            memoise_2.0.1
## [184] beeswarm_0.4.0            AnnotationDbi_1.70.0      cluster_2.1.8.1
## [187] globals_0.18.0            GSEABase_1.70.0