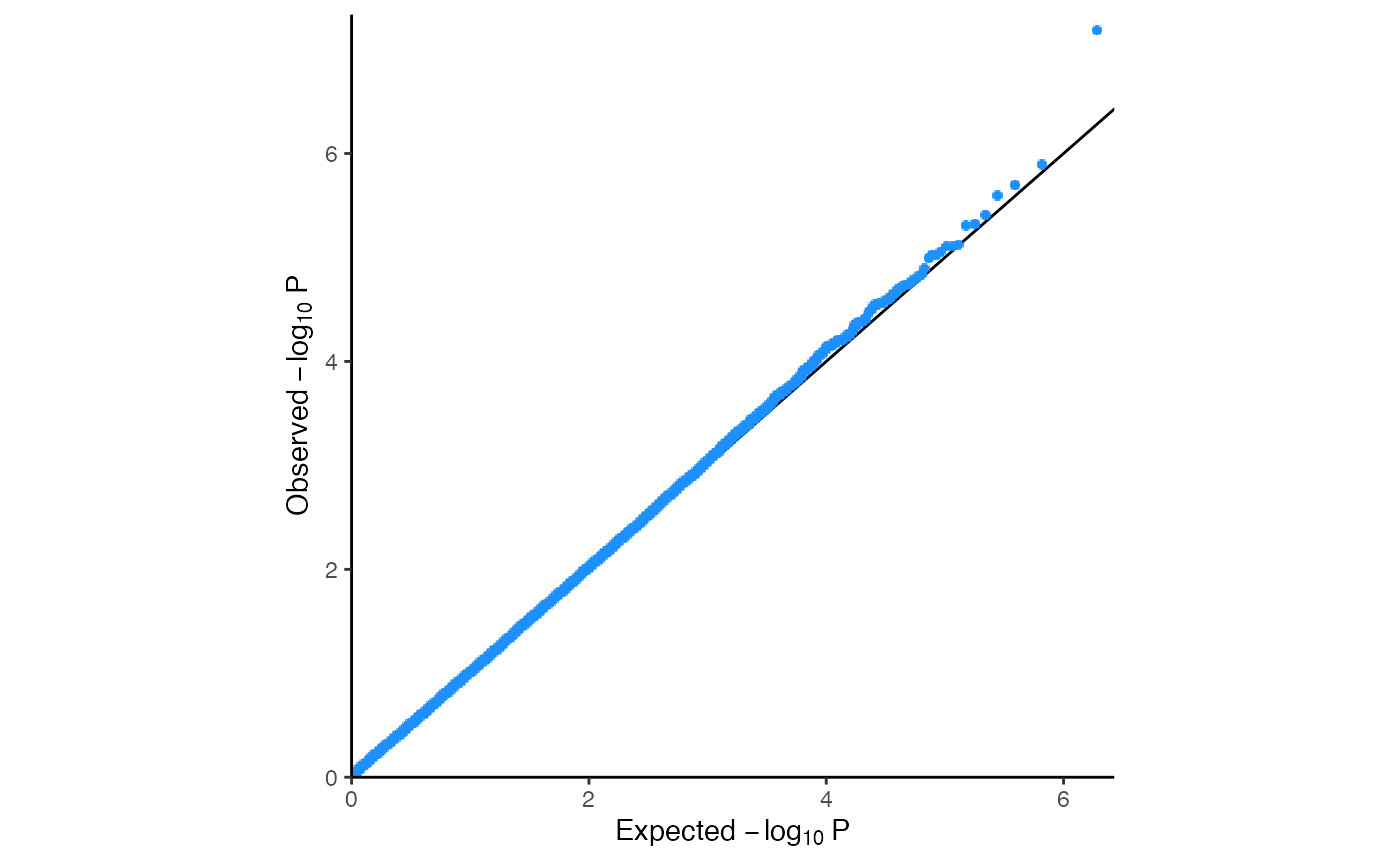
Saving a QQ plot with >1M p-values can be slow and create a huge PDF since each point is saved when using geom_point(). Instead, use geom_scattermore() to rasterize points. This saves an image of the points, so overlapping points are just plotted once. This dramatically reduces the size of editable PDFs.
Usage
qqgwas(pvalues, n = length(pvalues), pointsize = 4, color = "dodgerblue", ...)Examples
qqgwas(runif(1000000))