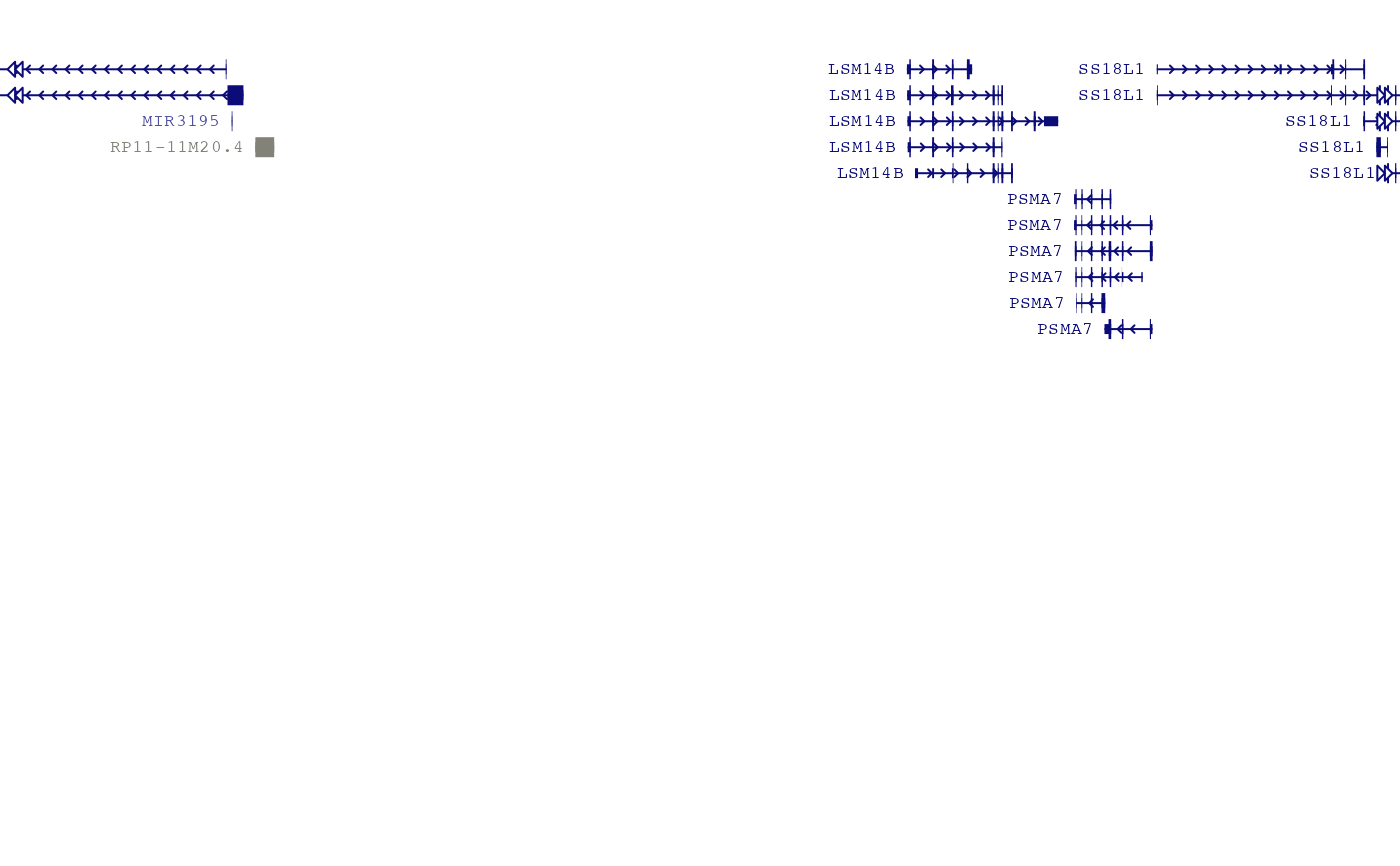
Plot ENSEMBL genes in region
Usage
plotEnsGenes(
  ensdb,
  minRange,
  maxRange,
  chromosome,
  plot_lines_distance = 0.03,
  vp = viewport(x = 0, y = 0.95, just = c("left", "top")),
  splice_variants = TRUE,
  non_coding = TRUE
)
Arguments
- ensdb
ENSEMBL database object like EnsDb.Hsapiens.v86
- minRange
start genome coordinate
- maxRange
end genome coordinate
- chromosome
chrom
- plot_lines_distance
veritcal distance between genes
- vp
viewport
- splice_variants
if TRUE, show multiple transcripts from the same gene
- non_coding
if TRUE, also show non-coding genes
