Plot density as color, add outlier points
Usage
plotDensityPoints(
  x,
  y,
  n = 100,
  outlierQuantile = 1e-05,
  densityExponent = 0.25
)
Arguments
- x
x values
- y
y values
- n
the number of equally spaced points at which the density is to be estimated.
- outlierQuantile
show points if density is less than this quantile
- densityExponent
color based on density^densityExponent
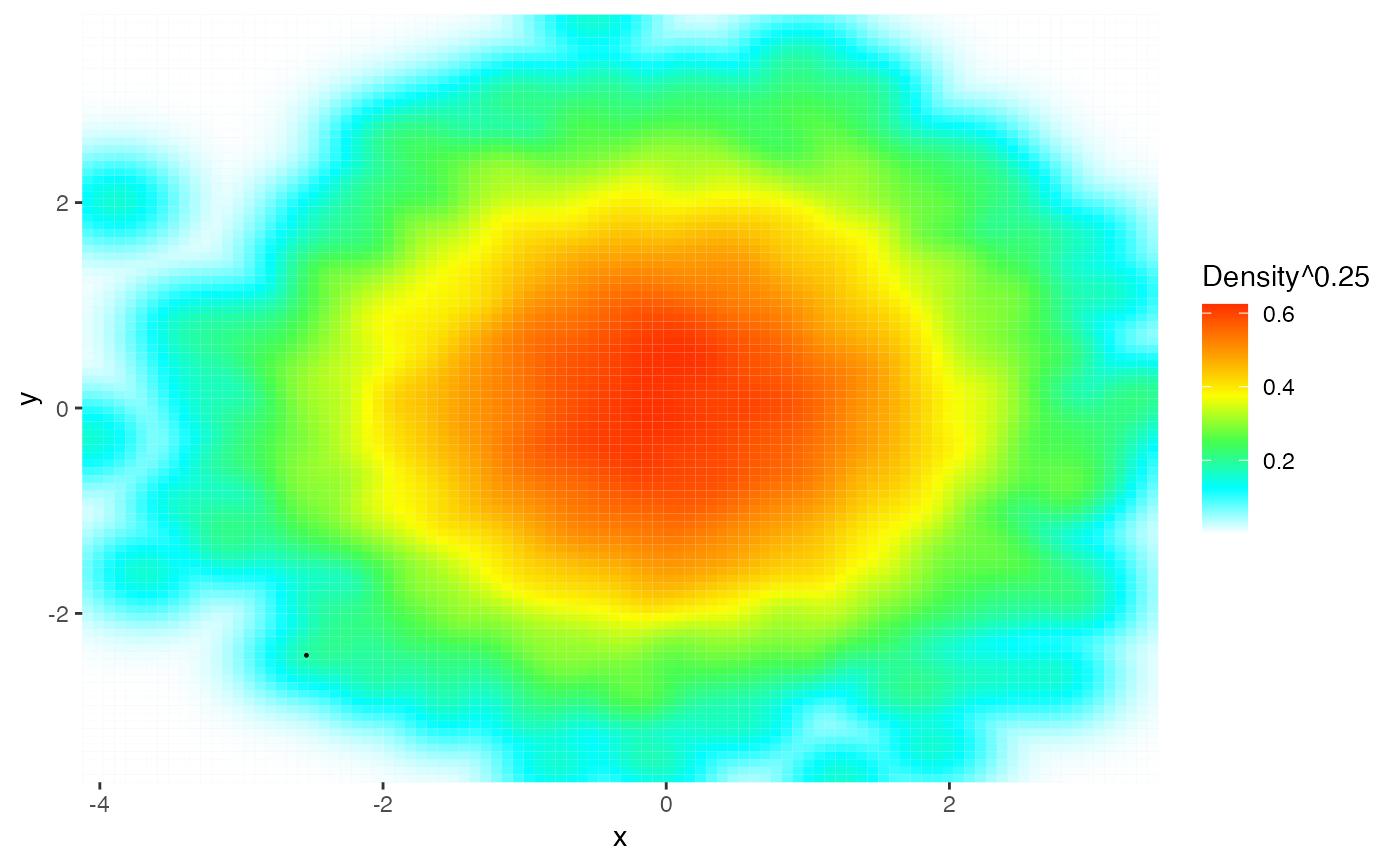
Examples
x = rnorm(10000)
y = rnorm(10000)

plotDensityPoints( x, y)