Plot voom curves from each cell type
Usage
plotVoom(x, ncol = 3, alpha = 0.5, ...)

# S4 method for class 'dreamletProcessedData'
plotVoom(x, ncol = 3, alpha = 0.5, assays = names(x))

# S4 method for class 'EList'
plotVoom(x, ncol = 3, alpha = 0.5)Examples
library(muscat)
library(SingleCellExperiment)
data(example_sce)
# create pseudobulk for each sample and cell cluster
pb <- aggregateToPseudoBulk(example_sce,
assay = "counts",
cluster_id = "cluster_id",
sample_id = "sample_id",
verbose = FALSE
)
# voom-style normalization
res.proc <- processAssays(pb, ~group_id)
#> B cells...
#> 0.054 secs
#> CD14+ Monocytes...
#> 0.099 secs
#> CD4 T cells...
#> 0.062 secs
#> CD8 T cells...
#> 0.037 secs
#> FCGR3A+ Monocytes...
#> 0.079 secs
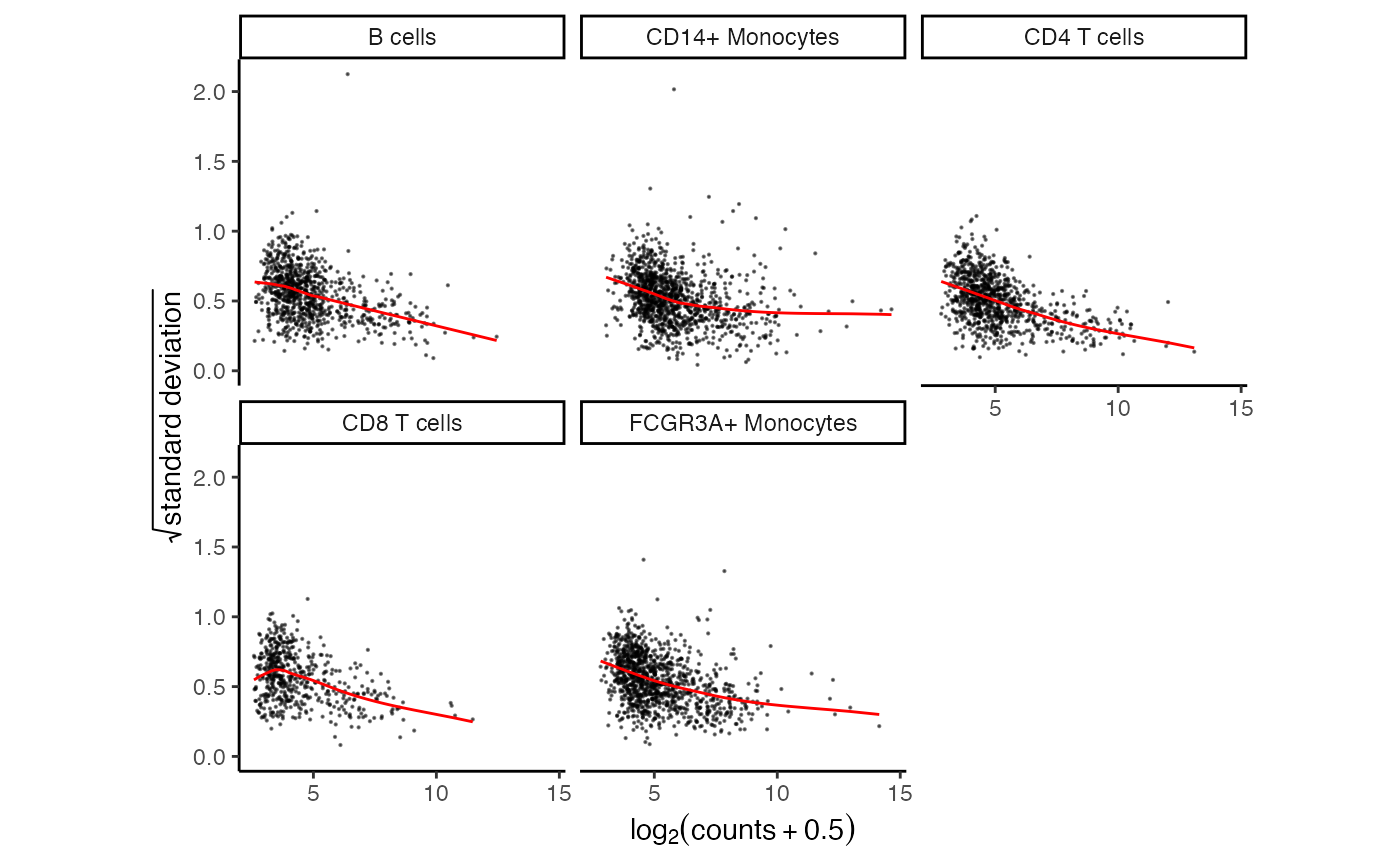
# Show mean-variance trend from voom
plotVoom(res.proc)
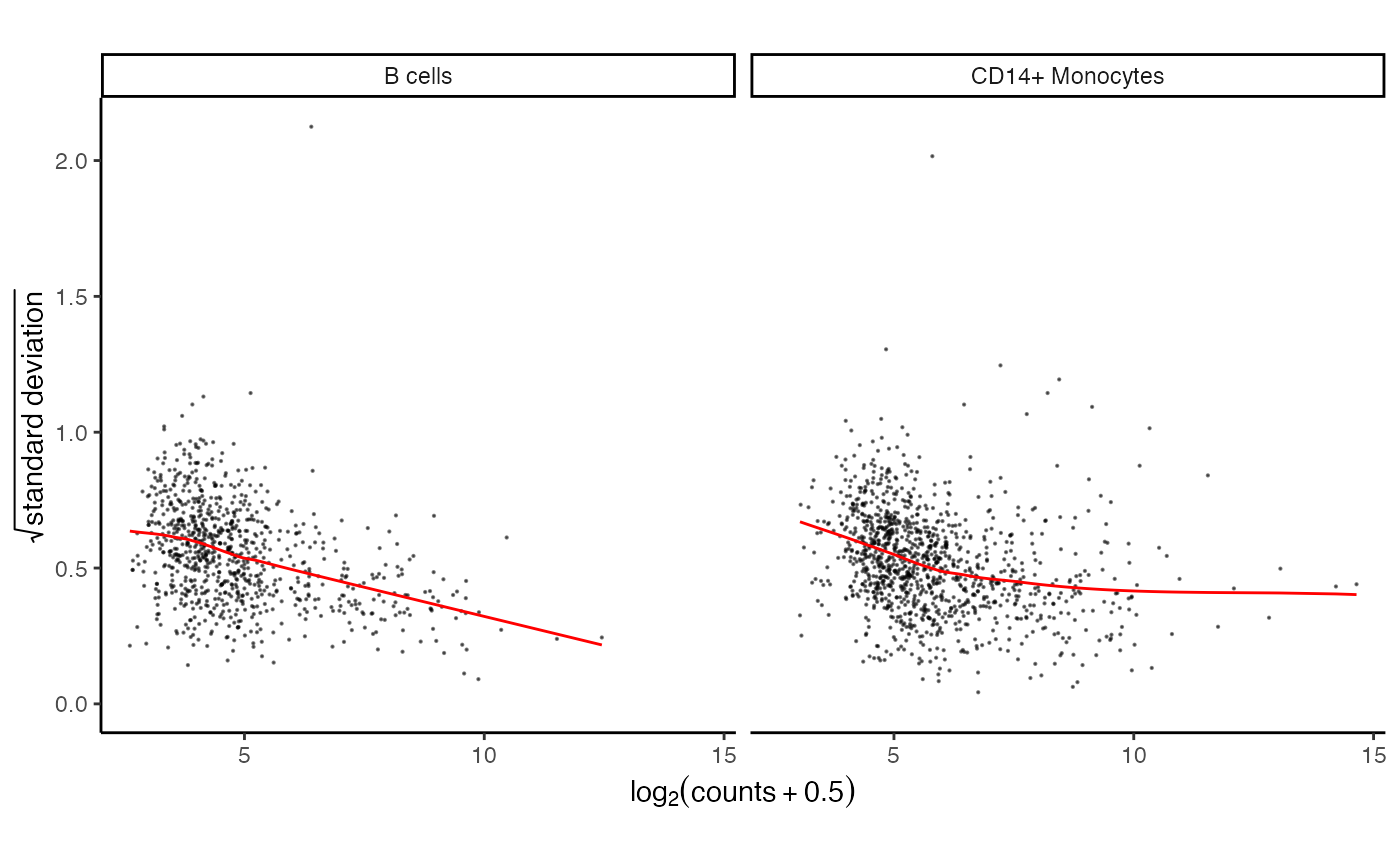
 # plot for first two cell types
plotVoom(res.proc[1:2])
# plot for first two cell types
plotVoom(res.proc[1:2])