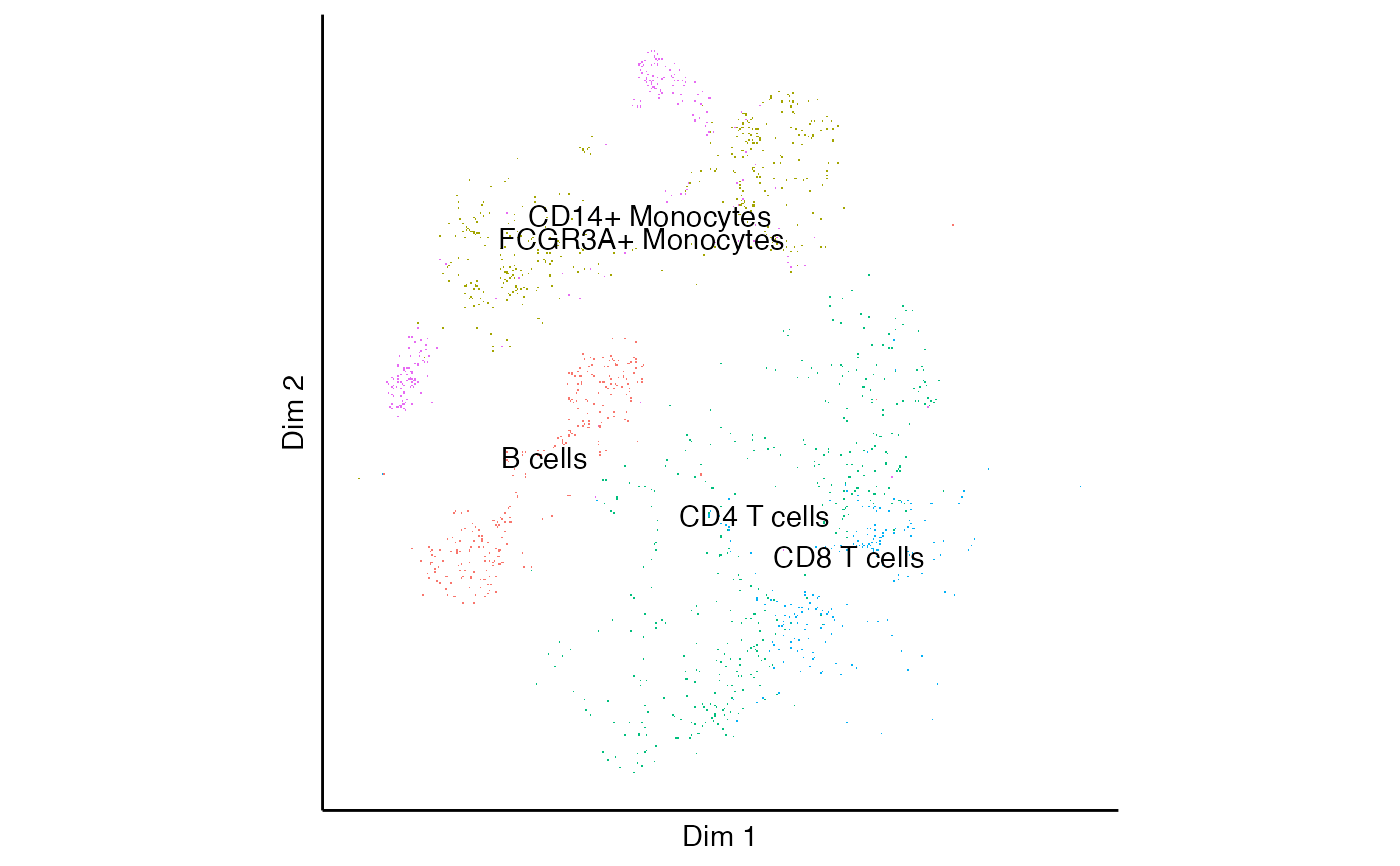
Plot 2D projection (i.e. UMAP, tSNE) for millions of cells efficiently
Usage
plotProjection(
  sce,
  type,
  annotation,
  pointsize = 0,
  pixels = c(512, 512),
  legend.position = "none",
  text = TRUE,
  order
)
Arguments
- sce
SingleCellExperiment- type
field in
reducedDims(sce)to plot- annotation
column in
colData(sce)to annotate each cell- pointsize
Radius of rasterized point. Use
0for single pixels(fastest).- pixels
Vector with X and Y resolution of the raster, default
c(512,512)- legend.position
legend.position: the position of legends ("none", "left", "right", "bottom", "top", or two-element numeric vector)
- text
show
annotationas text. DefaultTRUE- order
specify order of levels for
annotation
Details
Uses scattermore::geom_scattermore() to plot millions of points efficiently