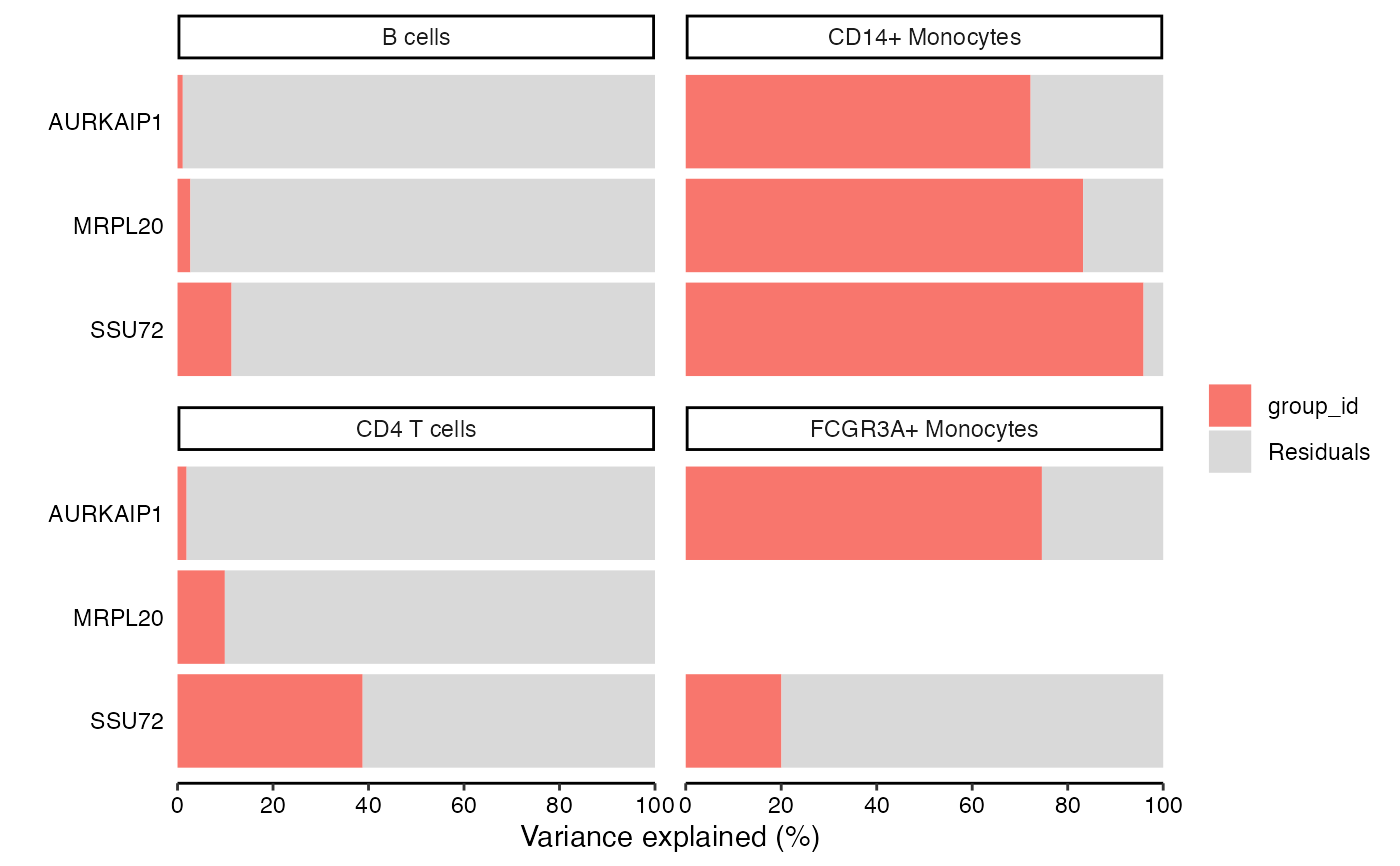
Bar plot of variance fractions for a subset of genes
Arguments
- x
vpDFobject returned byfitVarPart()- col
color of bars for each variable
- genes
name of genes to plot
- width
specify width of bars
- ncol
number of columns in the plot
- ...
other arguments
Examples
library(muscat)
library(SingleCellExperiment)

data(example_sce)

# create pseudobulk for each sample and cell cluster
pb <- aggregateToPseudoBulk(example_sce,
  assay = "counts",
  cluster_id = "cluster_id",
  sample_id = "sample_id",
  verbose = FALSE
)

# voom-style normalization
res.proc <- processAssays(pb, ~group_id)
#>   B cells...
#> 0.053 secs
#>   CD14+ Monocytes...
#> 0.086 secs
#>   CD4 T cells...
#> 0.063 secs
#>   CD8 T cells...
#> 0.048 secs
#>   FCGR3A+ Monocytes...
#> 0.08 secs

# variance partitioning analysis
vp <- fitVarPart(res.proc, ~group_id)
#>   B cells...
#> 0.6 secs
#>   CD14+ Monocytes...
#> 0.77 secs
#>   CD4 T cells...
#> 0.64 secs
#>   CD8 T cells...
#> 0.38 secs
#>   FCGR3A+ Monocytes...
#> 0.78 secs
#>

# Show variance fractions at the gene-level for each cell type
plotPercentBars(vp, genes = vp$gene[2:4], ncol = 2)
#> Warning: Ignoring empty aesthetic: `width`.