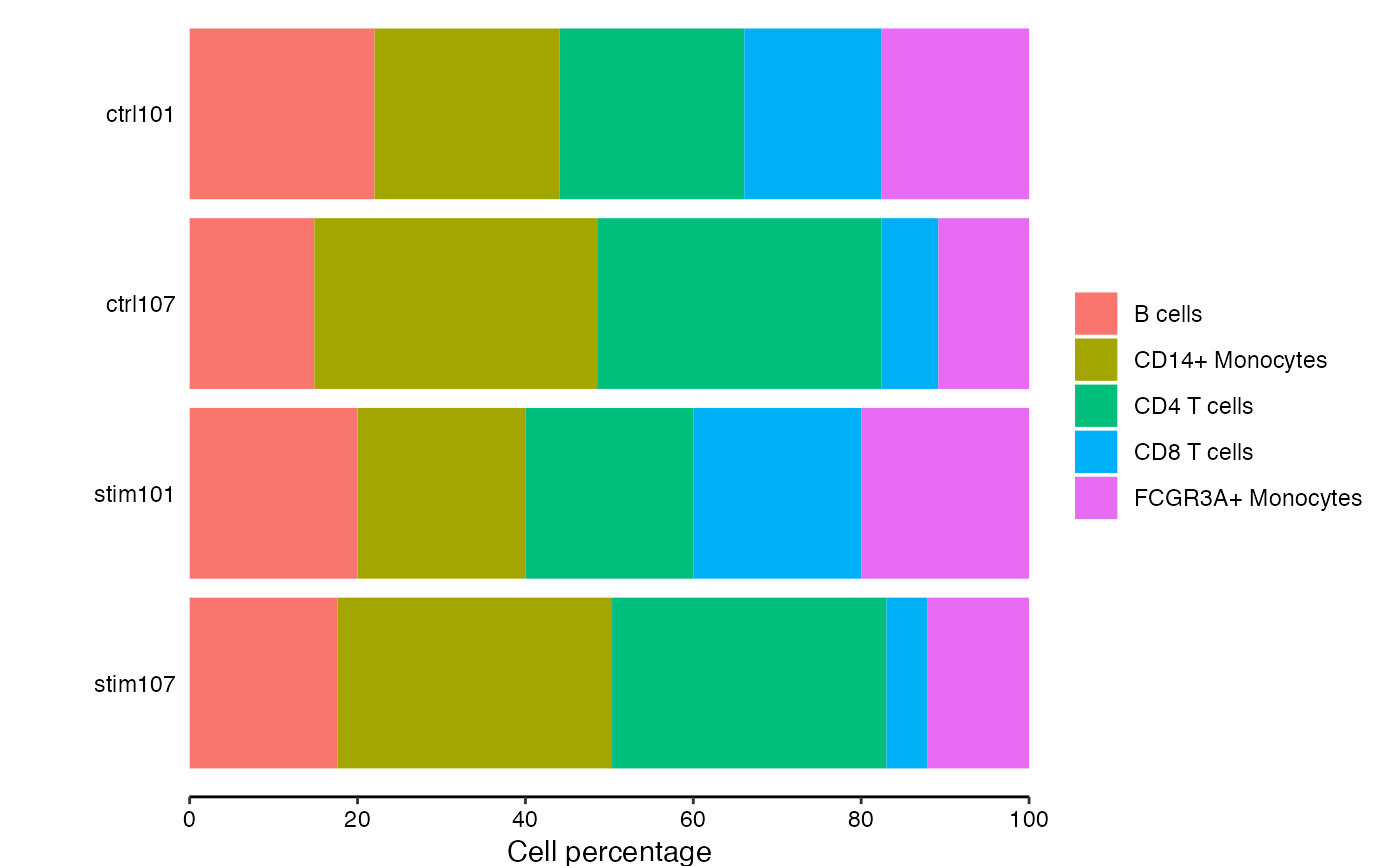
Bar plot of cell compositions
Usage
plotCellComposition(obj, col, width = NULL)

# S4 method for class 'SingleCellExperiment'
plotCellComposition(obj, col, width = NULL)

# S4 method for class 'matrix'
plotCellComposition(obj, col, width = NULL)

# S4 method for class 'data.frame'
plotCellComposition(obj, col, width = NULL)Examples
library(muscat)
library(SingleCellExperiment)

data(example_sce)

# create pseudobulk for each sample and cell cluster
pb <- aggregateToPseudoBulk(example_sce,
  assay = "counts",
  cluster_id = "cluster_id",
  sample_id = "sample_id",
  verbose = FALSE
)

# show cell composition bar plots
plotCellComposition(pb)


# extract cell counts
df_cellCounts <- cellCounts(pb)

# show cell composition bar plots
plotCellComposition(df_cellCounts)
# extract cell counts
df_cellCounts <- cellCounts(pb)
# show cell composition bar plots
plotCellComposition(df_cellCounts)
