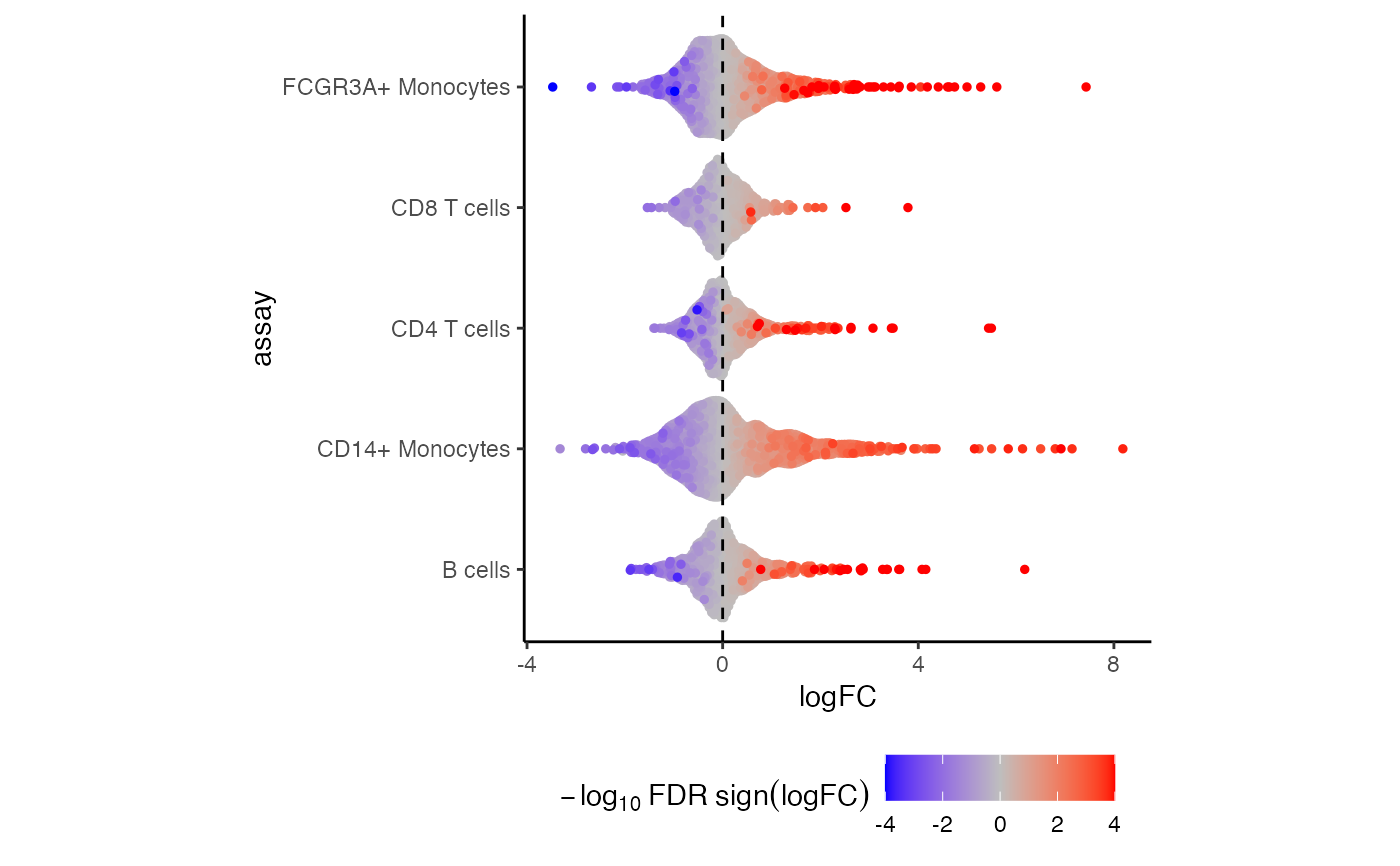
Beeswarm plot of effect sizes for each assay, colored by sign and FDR
Usage
plotBeeswarm(res.dl, coef, fdr.range = 4, assays = assayNames(res.dl))Arguments
- res.dl
dreamletResultobject fromdreamlet()- coef
coefficient name fed to
topTable()- fdr.range
range for coloring FDR
- assays
which assays to plot
Examples
library(muscat)
library(SingleCellExperiment)

data(example_sce)

# create pseudobulk for each sample and cell cluster
pb <- aggregateToPseudoBulk(example_sce,
  assay = "counts",
  cluster_id = "cluster_id",
  sample_id = "sample_id",
  verbose = FALSE
)

# voom-style normalization
res.proc <- processAssays(pb, ~group_id)
#>   B cells...
#> 0.054 secs
#>   CD14+ Monocytes...
#> 0.087 secs
#>   CD4 T cells...
#> 0.062 secs
#>   CD8 T cells...
#> 0.038 secs
#>   FCGR3A+ Monocytes...
#> 0.092 secs

# Differential expression analysis within each assay,
# evaluated on the voom normalized data
res.dl <- dreamlet(res.proc, ~group_id)
#>   B cells...
#> 0.049 secs
#>   CD14+ Monocytes...
#> 0.063 secs
#>   CD4 T cells...
#> 0.051 secs
#>   CD8 T cells...
#> 0.032 secs
#>   FCGR3A+ Monocytes...
#> 0.062 secs

# Beeswarm plot of effect sizes for each assay,
# colored by sign and FDR
plotBeeswarm(res.dl, "group_idstim")